Flood Forecasting Architecture
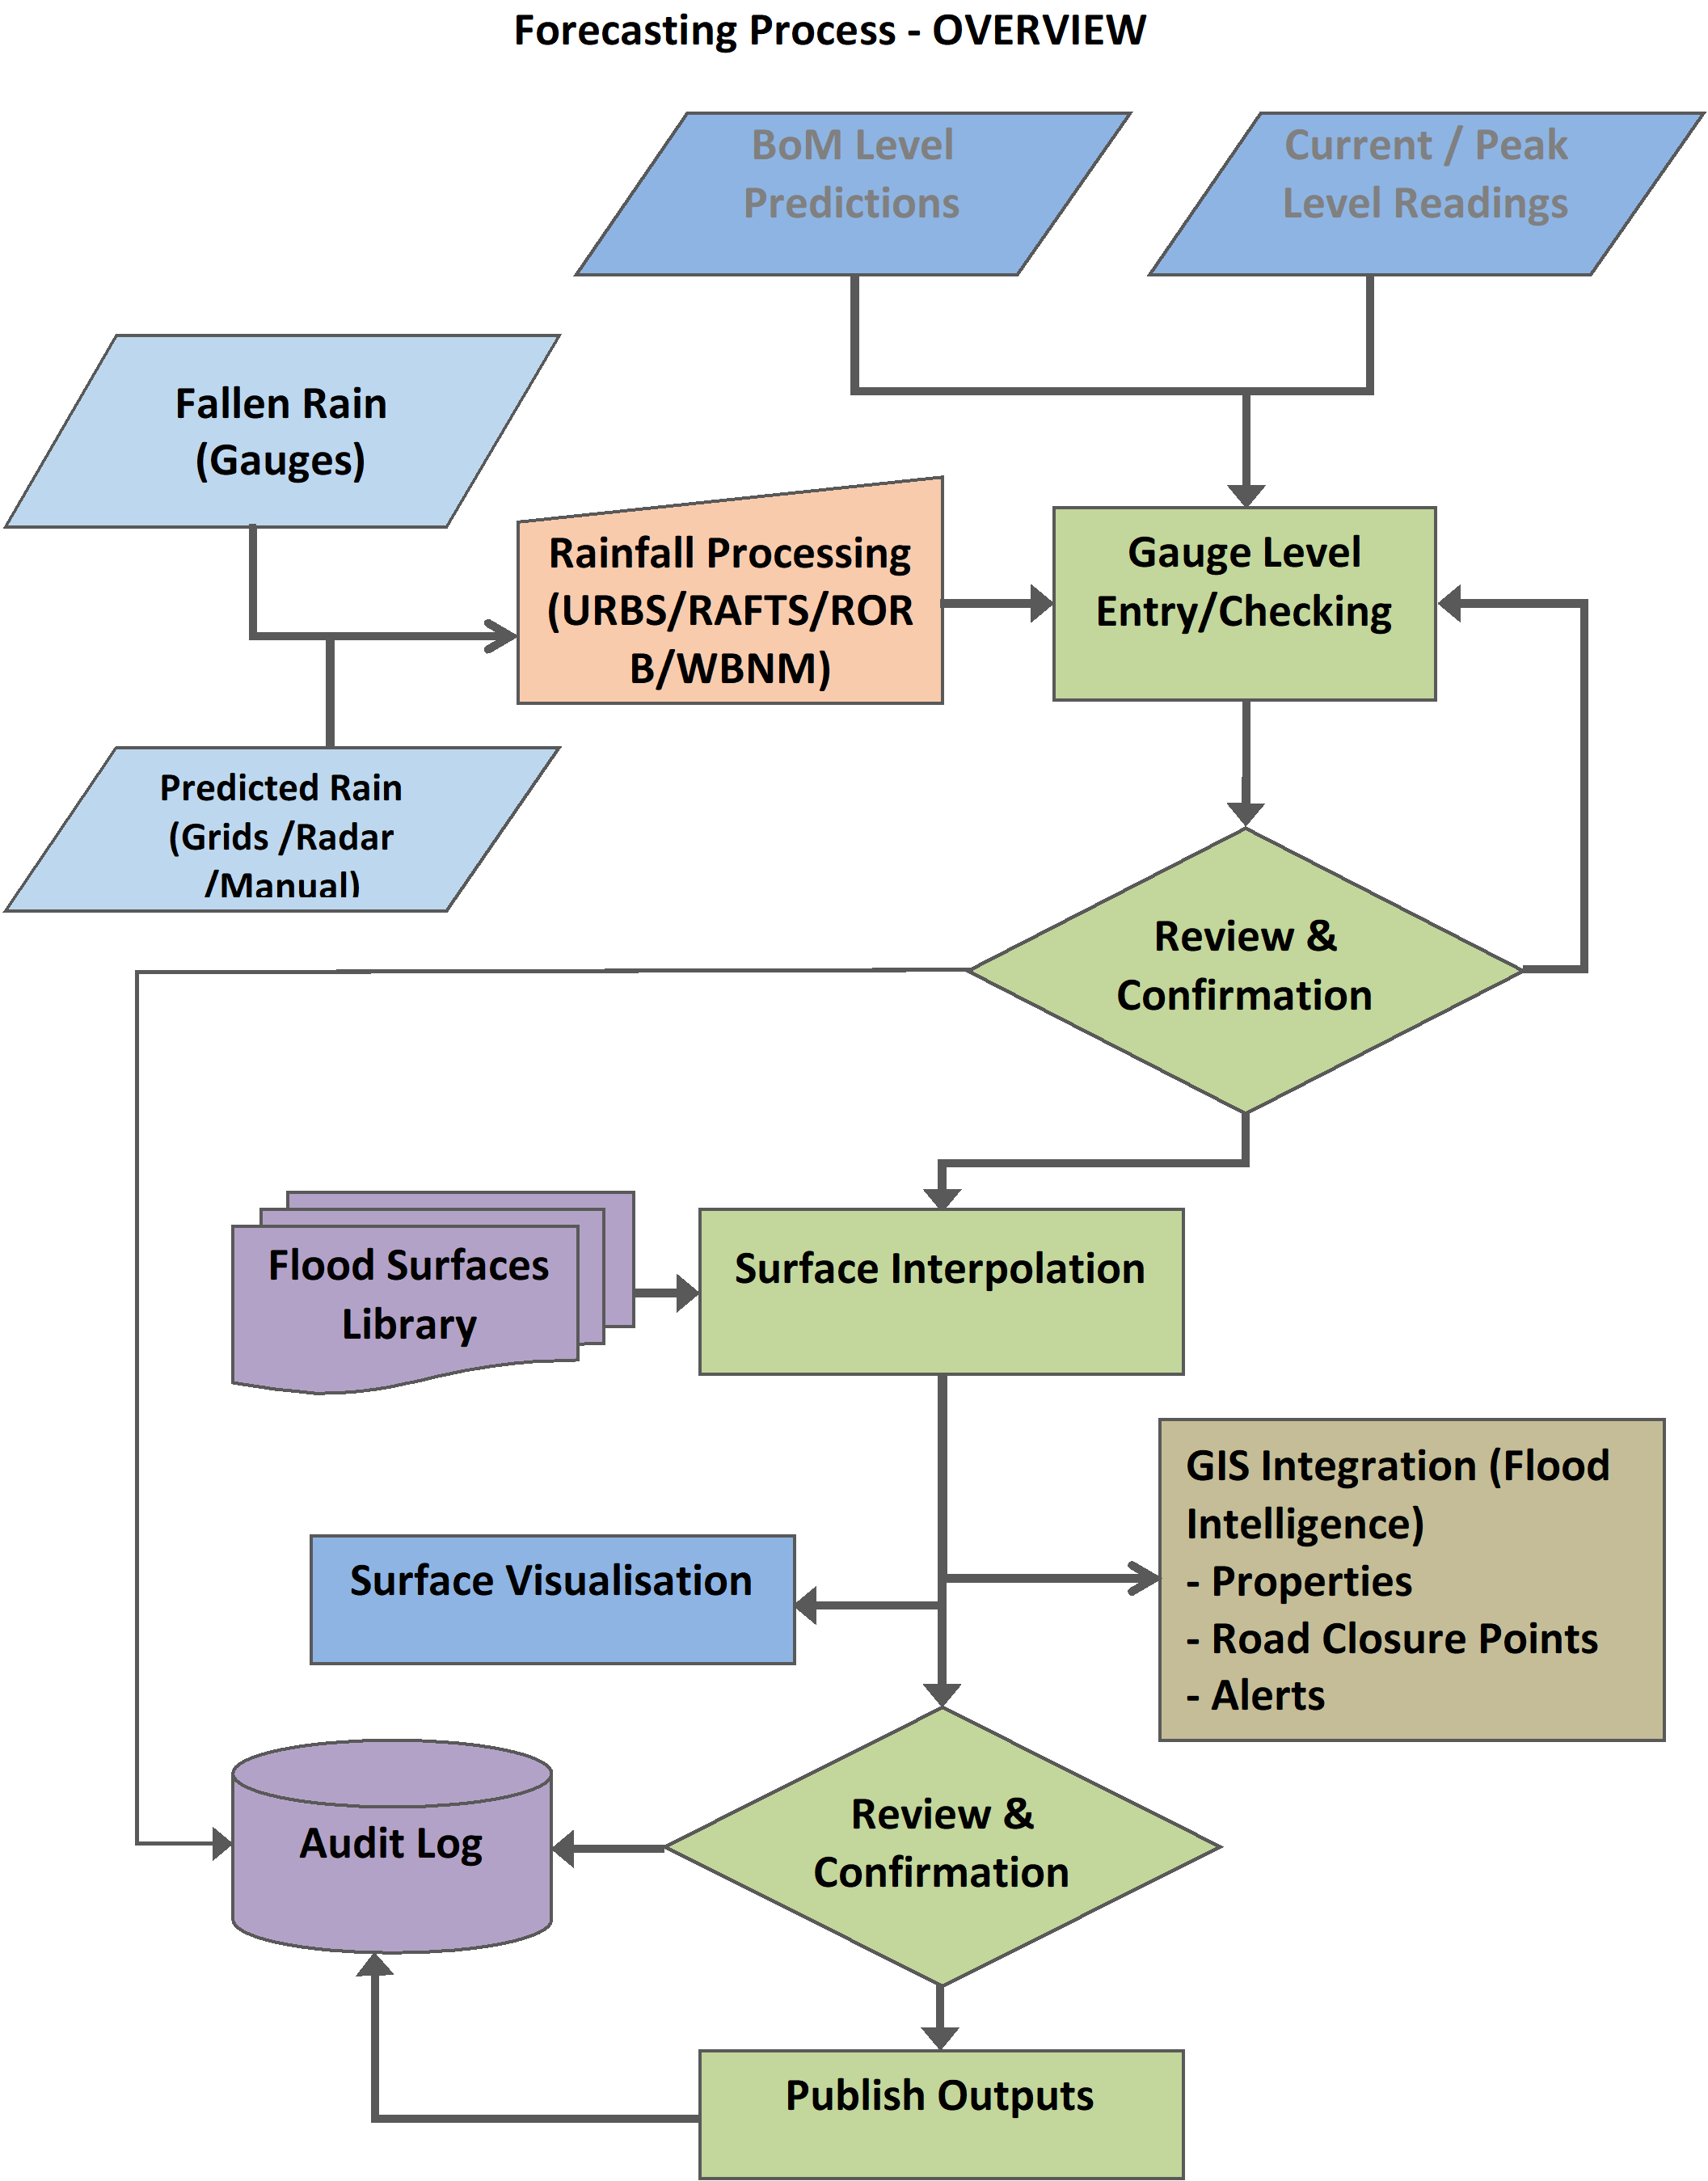
An operating flood forecast system is highly procedural and relies on a significant amount of data layers, reference files and configuration settings.
waterRIDE facilitates a wide range of approaches to forecasting which allows a system to best leverage available datasets in your catchment.
The simplest method of generating a forecast is to input the gauge level(s) directly on the basis of current gauge readings or BoM predictions. This approach is ideal if external organisations provide predicted flood levels or flows at locations in your catchment.
Such gauge readings/predictions may not be available for all catchments, especially those flashier catchments for which federal agencies may not provide forecast levels. In this case, actual and/or predicted rainfall can be used to determine likely flows/levels in the catchment. Primarily, this is achieved through real-time hydrologic modelling.
The forecast engine uses the entered gauge levels to generate an interpolated flood surface using the library of modelled flood surfaces (hydraulic interpolation). If predicted rain is used to estimate a gauge level, a sensitivity surface can also be generated showing the relative extents of the predicted level plus or minus an amount using a variation in the rainfall.
Finally any flood surface/GIS integration tasks are run (such as road closure depths) to create expected flood intelligence on the likely implications of the forecast flood.
The following flow diagram details the interaction and sequential processing of a flood forecast during an event.
Hydraulic Interpolation - Theory
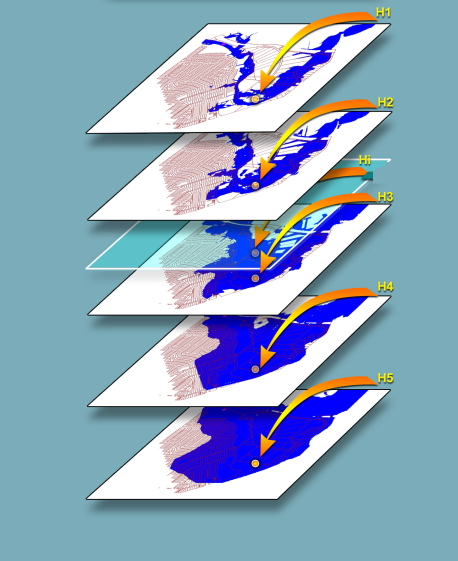
The Flood Forecast tool allows the user to setup a system for deriving peak water surface (levels and depths) from a predicted gauge (river) level. Using a library of design water surfaces (*.wrb or *.wrr), covering a range of flood events, a predicted flood surface is interpolated using the gauge level to determine which two surfaces to interpolate between (one above the gauge level and one below).
In the figure below, Hi is the predicted gauge level. The library of design flood surfaces (H1 to H5), is examined at the gauge location to determine the upper surface (H2) and lower surface (H3) to use in interpolation. The predicted surface is then interpolated at all locations on the surface using the ratio between the surfaces at the gauge location. In this way, the water surface profile and slope is preserved.
For example, the figure below shows a profile extracted from a predicted water surface for a gauge level between the 1 in 100 and PMF flood events.
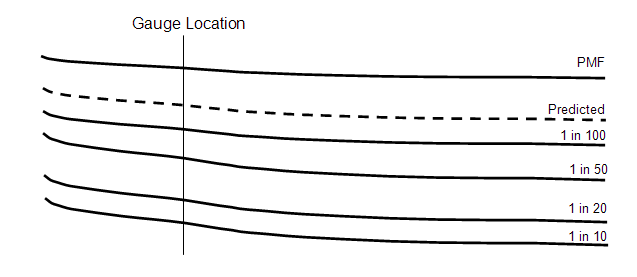
Note that a predicted surface can only be interpolated between two design flood surfaces (ie it cannot be extrapolated beyond a known surface). Therefore, it is important to ensure that the design flood surfaces cover the range of floods for which the forecast tool is expected to be used.
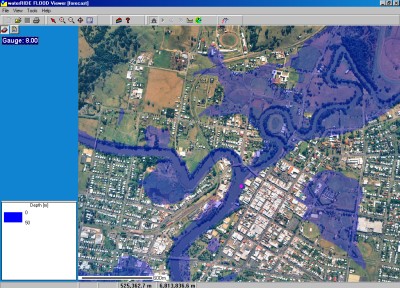
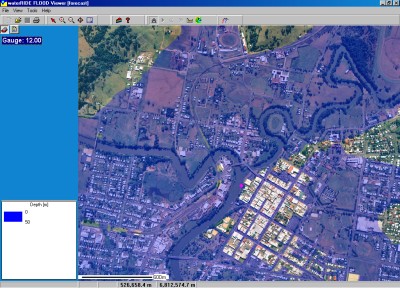
The first figure, above, shows the predicted surface for a gauge level of 8.0m. The second figure shows the predicted surface for a gauge level of 12.0m.
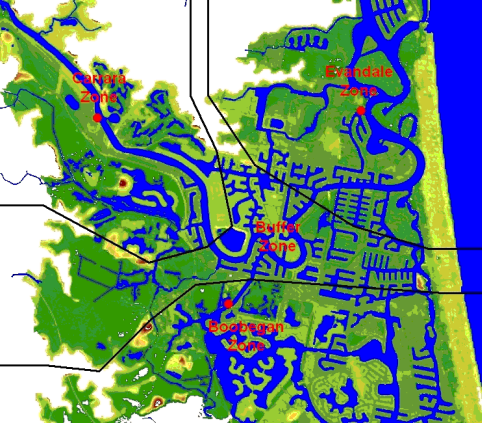
Often, flood model results cover a number of catchments. In such cases, it is important to preserve the relative degree of flooding in each catchment in any predicted surface. For example, one catchment may be experiencing the 1 in 20 year flood event whilst another is experiencing the 1 in 100 year flood event. With a gauge level in each catchment, waterRIDE™ can warp the predicted water surface to account for the differing degrees of flooding across the catchment.
This is achieved by setting up Zones of Influence for each of the gauges in the catchment (Gauge Zones). Within any gauge zone, the predicted water surface is interpolated using only the gauge within that zone. Between zones (an area known as a Buffer Zone) predicted flood levels are interpolated using a distance weighted average of the surrounding gauges.
The figure below shows a system with 3 gauges. There is one zone of influence for each gauge and a buffer zone in between.
To setup a flood forecast system, refer to Setting Up A Flood Forecast System.
For instructions on running a forecast system, refer to Running a Flood Forecast.