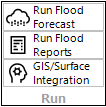
1) If a flood forecasting project is opened, a Forecast can be run by clicking Run Flood Forecast in the Run group on the Interrogate live panel. This button can be pressed at any time within a project for which forecasting has been setup, and only using Manager mode.
This will bring you to the Forecasting Landing Page:
2) Specify User and Event Details

An name or identifier should be given to each new event. Firstly, verify the username and enter a suitable event name (eg Cycle Debbie 2017). Pressing ![]() will then start that event. All actions associated with forecasting and publishing will be logged to a daily log file that includes this event name. Such logs can be viewed both during and after an event on the Process Log tab. Once an event has started, the audit log cannot be turned off until the event has been marked as finished by clicking the
will then start that event. All actions associated with forecasting and publishing will be logged to a daily log file that includes this event name. Such logs can be viewed both during and after an event on the Process Log tab. Once an event has started, the audit log cannot be turned off until the event has been marked as finished by clicking the ![]() button.
button.
Casual logs can be toggled on and off by leaving the event name as NO EVENT.
3) Select an option from the list:
![]() RAINFALL – Use fallen rain and/or predicted rain to estimate gauge levels. (Note that for any systems running from gauged fallen rain, it is suggested that the rainfall gauges are assessed prior to execution)
RAINFALL – Use fallen rain and/or predicted rain to estimate gauge levels. (Note that for any systems running from gauged fallen rain, it is suggested that the rainfall gauges are assessed prior to execution)
![]() MANUAL – Go directly to the Gauge Level Data tab and enter the predicted gauge level(s) or ARI’s
MANUAL – Go directly to the Gauge Level Data tab and enter the predicted gauge level(s) or ARI’s
![]() STORM TIDE – Enter a simple forecast storm tide level directly, or access gauge-based forecasts
STORM TIDE – Enter a simple forecast storm tide level directly, or access gauge-based forecasts
![]() EXTERNAL TABLE – automatically load gauge levels/ARI’s from an an external tabular source (such as CSV file)
EXTERNAL TABLE – automatically load gauge levels/ARI’s from an an external tabular source (such as CSV file)
![]() SCENARIO LEVELS - Manually enter multiple gauge levels as "scenarios" to faciliatte easy "what if" consequence analysis
SCENARIO LEVELS - Manually enter multiple gauge levels as "scenarios" to faciliatte easy "what if" consequence analysis
![]() RECORDED LEVELS – Use recorded river gauge levels
RECORDED LEVELS – Use recorded river gauge levels
![]() LIBRARY SURFACE – Select a specific flood surface from the library in lieu of forecast interpolation
LIBRARY SURFACE – Select a specific flood surface from the library in lieu of forecast interpolation
![]() LOOKUP TABLE - Use an external lookup table to determine gauge levels
LOOKUP TABLE - Use an external lookup table to determine gauge levels
![]() Use this button to manually import any gauge rainfall/river levels data. waterRIDE will indicate if newer gauge data is available. If using waterRIDE Forecast Console, this will happen automatically.
Use this button to manually import any gauge rainfall/river levels data. waterRIDE will indicate if newer gauge data is available. If using waterRIDE Forecast Console, this will happen automatically.
![]() Brings up the input data status panel. This panel provides the following information on each layer providing information to the forecasting process:
Brings up the input data status panel. This panel provides the following information on each layer providing information to the forecasting process:
- FileDate last edited (the date the file/datasource was last updated/collected by waterRIDE)
- Data range stating Date (the starting date of information in the file)
- Data range ending Date (the end date of information in the file)
For example, if the FileDate was changed 1hr ago, but the last data record in the file is from 2 days ago, the data source is possibly down (eg Met Service FTP site).
![]() Brings up the waterRIDE Forecast Console log file if being used to automatically collect input datasets.
Brings up the waterRIDE Forecast Console log file if being used to automatically collect input datasets.
![]() If configured, opens the waterRIDE Forecast Console application for manual execution.
If configured, opens the waterRIDE Forecast Console application for manual execution.
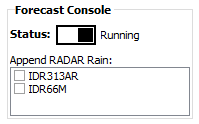 The status Toggle switch indicates the current operation status of the console (Running/Paused). When opening the console for use in manual mode, you should toggle the console to paused mode, which will pause the automated execution (ie you can run the system in full manual mode to control when datasets are updated). Any BoM Radar datasets being used in a forecast can be toggled between append and replace mode by ticking the relevant box (tick to enter append mode). Generally, you would use append mode in conjunction with a moving window (eg the last 7 days of data - which can be configured in your Forecast Console Script).
If a lookup table has been configured, gauge levels can be determined by entering the lookup parameter and pressing ![]() .
.
4) If the selected forecasting approach requires additional information, enter the relevant information and then click the Proceed button to continue.
5a) ENTER FORECAST RAINFALL (if required)
If running real-time hydrology or hydrologic interpolation, an intermediate step is associated with entering the rainfall to drive a flood forecast. A hydrology model can be run using fallen rain, fallen + predicted rain, or predicted rain only. During an event, you may use multiple approaches as the event unfolds.
You can load the parameters used in the previous run (if available) by clicking ![]() . The date/time of the last run and the username of the operator are available, for reference.
. The date/time of the last run and the username of the operator are available, for reference.
Fallen rainfall can be read from:
a) Gauge Layer - rainfall gauges
b) Rainfall grids - time-varying fallen rain grids such as those from the BoM and WeatherZone. These are often a blend of radar and gauge data.
Predicted rainfall can be entered as:
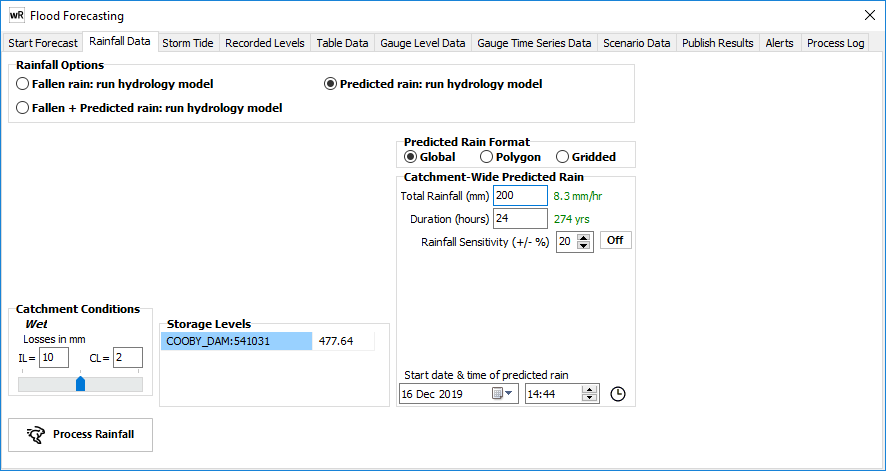
a) Global rain (manual) - rainfall is distributed uniformly across the catchment as a rainfall total over a specified period ( eg 200mm over 12hrs). If configured, equivalent ARI's for global rain are displayed in green.
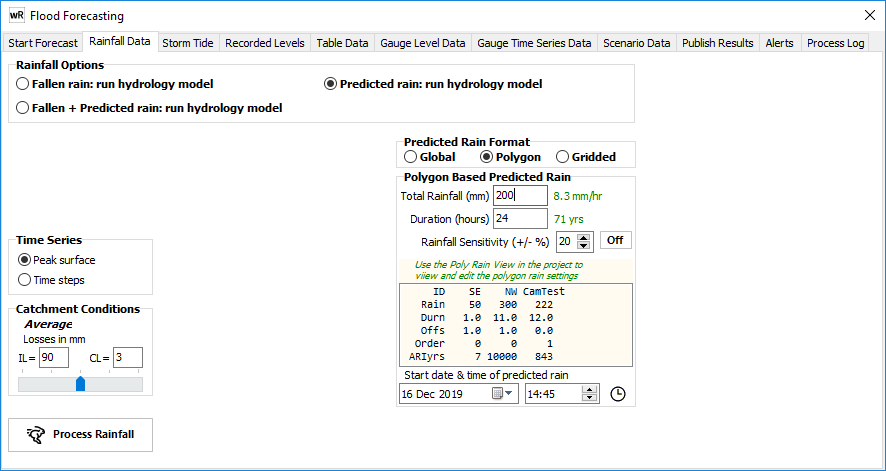
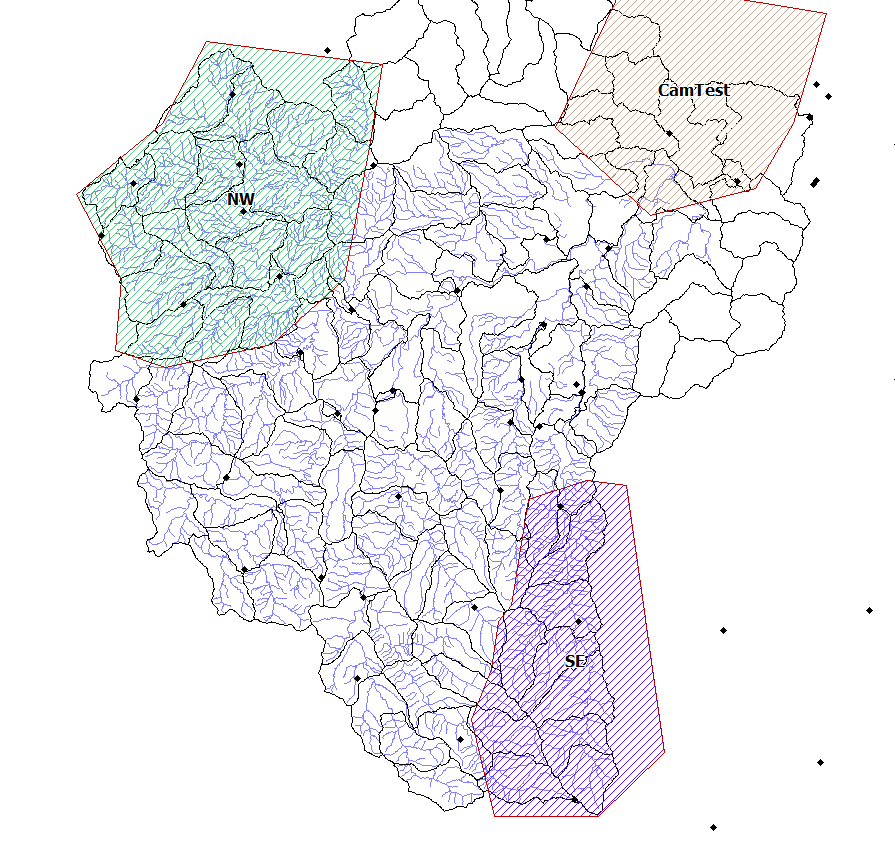
b) Polygon rain (manual) - rainfall is distributed across the catchment according to a GIS layer of polygons. Each polygon must have a rainfall total over a specified period and a time offset that is applied to the start of the rainfall. The global rain parameters are used for any sub-catchment/node outside the polygons and to "pad out" any polygon rain with a duration smaller than the global rain duration. The global rain duration must be longer than an polygon rain duration plus offset. Where polygons overlap, a priority field is used to define the which rainfall polygon is used. Rainfall total/duration are stored in the polygon rain GIS layer for ready visualisation.
c) Gridded rain - will read rainfall from the selected gridded dataset (generally a forecast rainfall grid).
The start date of forecast rainfall will either be the current date time (forecast rain only), or the start date of the event (fallen or fallen + forecast rainfall). Fallen rain will always be used in preference to forecast rain where time windows overlap. If the forecast grid does not provide rainfall information beyond the selected fallen rain grid time window, an orange warning box will appear around the forecast data start time indicating that it will not be used. This may indicate an issue with the collection/updating of any forecast rainfall grids.
If configured, sensitivity runs can be executed by turning it on and entering the relevant % to use.
Any relevant initial storage levels should be entered/verified.
Catchment conditions should be specified if configured. Adjust the slider to move through the configured catchment conditions or, if desired, continuing and initial loss values can be overridden (temporarily) by entering values in the relevant box.
If configured, a time series or peak surface can be generated (hydrology models only). A time series surface will take considerably longer to generate than a peaks only surface. A time series surface does not need to be created to extract time based flood intelligence for GIS layers.
Global Rain Example:
Polygon rain GIS file example:
Gridded Rain (Actual fallen + gridded forecast) Example:
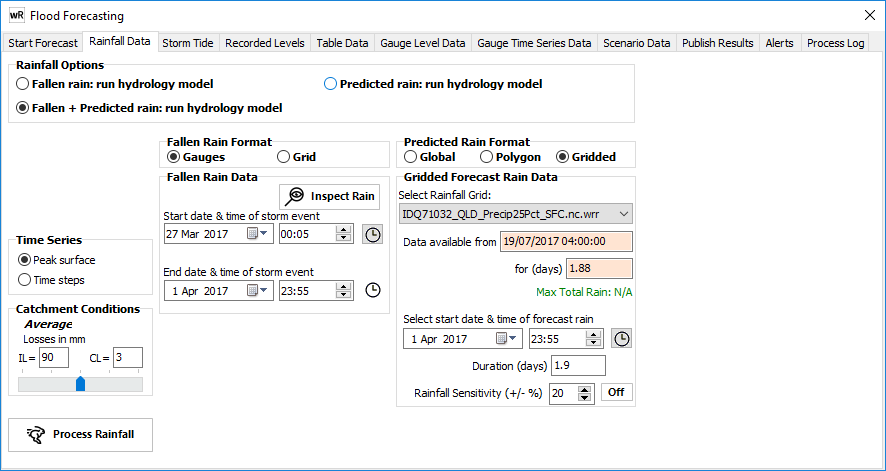
In the above screenshot, the predicted rainfall grid time window does not extend beyond the fallen rain grid window and will, therefore, not be used. The orange warning box highlights this and may indicate an issue with collection/conversion of forecast rainfall grids.
5b) ENTER STORM TIDE
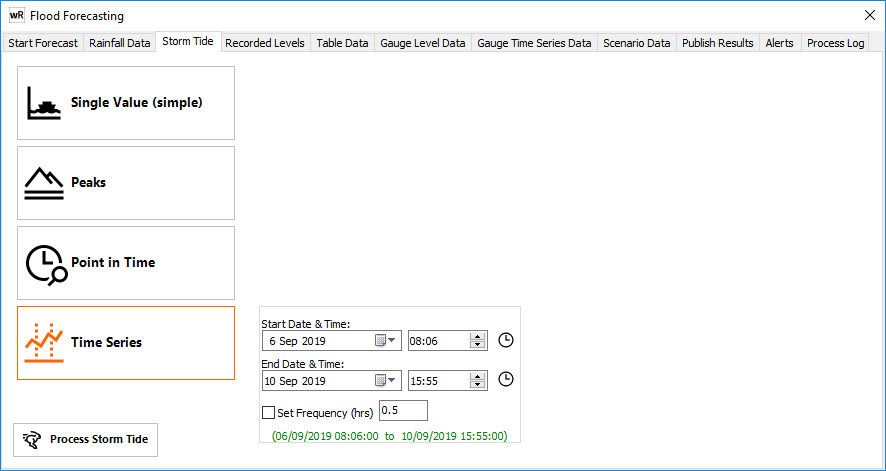
Storm Tide forecast levels can be processed as either a Simple value (Enter a single storm surge value covering the entire coastline), or using forecast gauge levels:
- Single value (simple) - a blanket storm surge value across the entire surface.
- Peaks - the maximum level at each gauge across the entire available time window
- Point In Time - a single timestep within the data window
- Full Time Series - a time series surface across the specified window
6) MANUALLY ENTER FORECAST GAUGE LEVELS
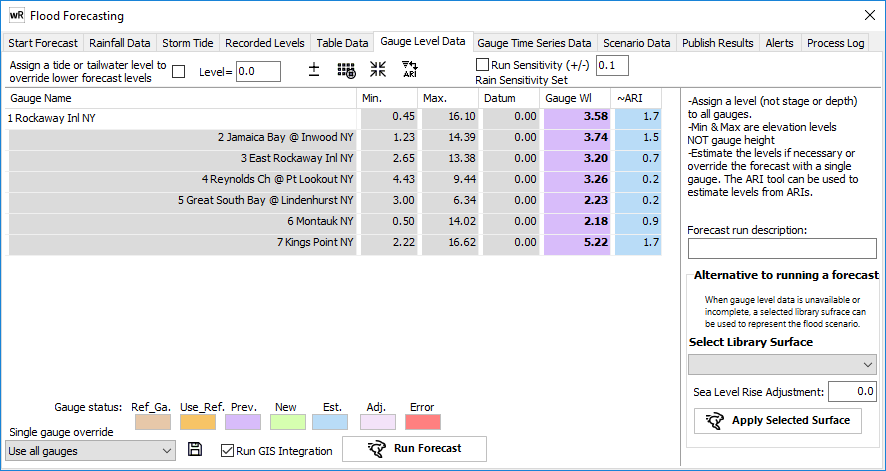
Enter the forecast gauge levels in the “Gauge WL” column. If using input rainfall or external flow/levels files, these values will be automatically populated.
Once the gauge level(s) have been set (manually, or read automatically), they should be checked for consistency before continuing. A valid value is required for each gauge and must be within the min to max range to facilitate interpolation.
The tool button above the Gauge Wl column (![]() ) will automatically adjust the level to the min or max range as appropriate.
) will automatically adjust the level to the min or max range as appropriate.
The min & max values identify the range of levels from the library of surfaces for each gauge (e.g. 10yr ARI up to PMF). The Datum Adj. value can be applied to the respective gauge “reading” value.
If gauge readings are in gauge datum, click ![]() to add the relative gauge datum to convert to the height datum used for the water surfaces in the forecast library (eg m AHD).
to add the relative gauge datum to convert to the height datum used for the water surfaces in the forecast library (eg m AHD).
To clear a previous forecasts values, click ![]() .
.
If setup, the indicative ARI of the forecast gauge level will be displayed in the gauge data entry table. This is interpolated directly from the surfaces in the forecasting library and must be specified as part of the forecast setup process.
To adjust any values, either enter the gauge level directly, or enter an ARI. Clicking the “interpolate blanks” button (![]() ) allows you to enter either an ARI or a gauge level, and have the other parameter calculated. This can be useful if, for example, you wish to forecast using an expected ARI. To use this tool, ensure that either the ARI or gauge WL column are blank.
) allows you to enter either an ARI or a gauge level, and have the other parameter calculated. This can be useful if, for example, you wish to forecast using an expected ARI. To use this tool, ensure that either the ARI or gauge WL column are blank.
If sensitivity has been configured you can adjust the upper and lower gauge levels directly in the grid. If a manual forecast is being executed, sensitivity can be turned on (if configured), and a default +/- directly applied to the gauge levels by clicking the "apply" button.
If tidal or backwater effects are likely to affect the lower reaches of the forecast stream, there is an option to override lower forecast water levels with the specified tide or tailwater level as a minimum value. To activate this feature, please check the box in the top panel and enter the appropriate level.
Any configured GIS integration (*.vmfpm scripts) or flood reports (*.vmrep scripts) will only be executed if the Run GIS Integration box is ticked. When publishing, users will be prompted to re-run any GIS integration, if needed, to ensure that published datasets are consistent.
Click the Run Forecast button to execute the forecast interpolation process. The red label next to the button will display ‘Processing’ whilst the forecast is being executed and ‘Done’ when it has finished, and when it has finished the page will change to the “Publish Results” tab.
If desired, any one of the library surfaces can be specified as the forecast surface (with any tailwater applied). In this case select the required library surface on the right panel and click the Apply Selected Surface button. If Sea Level Rise is to be applied to the selected surface, enter the value to add to the surface. This is only available if a storm surge forecasting project has been configured.
7) PUBLISH RESULTS
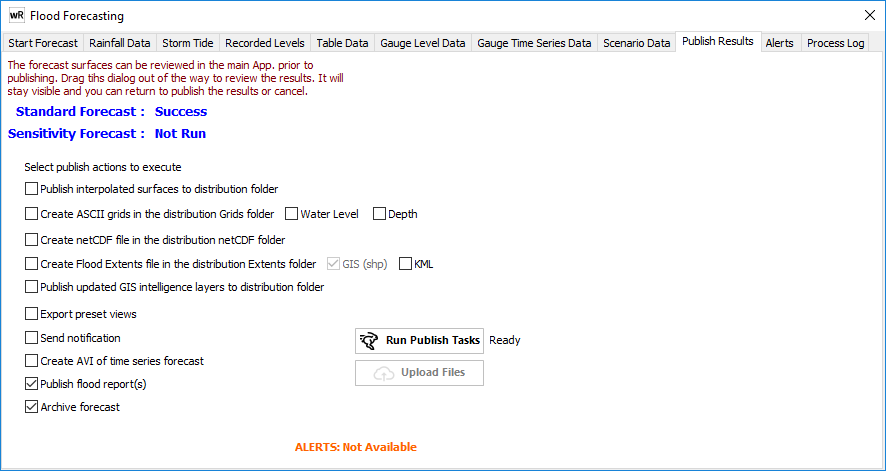
Once the forecast has finished the resulting interpolated flood surface and the sensitivity surface (if it has been run) should be checked for consistency prior to any publishing for wider consumption.
The forecast form will stay on top of the main form whilst it is open. To review the results, simply move the form out of the way by dragging its title bar. The interpolated surface can then be zoomed, panned and interrogated before proceeding. If the results are not as expected, the rainfall and forecast process can be adjusted and repeated.
When the interpolated surface has been verified, the results of the forecast (interpolated surface, sensitivity surface and GIS integration layers) can be ‘published’ by copying them to a pre-determined network folder to allow other end users, such as emergency management personnel, to view the predicted flood surface using waterRIDE FLOOD in Viewer mode with a pre-prepared project setup for their needs.
Initially, the Publish page will show the status of the forecast and sensitivity runs as “Success”, “Failed” or “Not Run”. Tick the selected actions to be executed when the Run Publish Tasks button is clicked:
•copying the interpolated surfaces to the publish distribution folder,
•creating an ASCII grid of the interpolated water and/or depth surface (for use with GIS systems) and copying it into the {PUBLISH}\GRIDS folder,
•creating a flood extents GIS file from the interpolated flood surface, and copying it into the {PUBLISH}\EXTENTS folder (note that this could take several minutes for larger surfaces),
•copying any GIS integration layers to the distribution folder
•Exporting present views as an XML configured dataset for web display
•processing any configured notifications/alerts
•creating an AVI for any time varying forecasts
•publishing any flood reports
•archiving key input/output datasets
When datasets have been published, the "Upload Files" button can be used (if configured) to copy any number of files to a specific folder. waterRIDE FORECAST Console can then be used to automatically/manually upload all files in this folder to the specified FTP server.
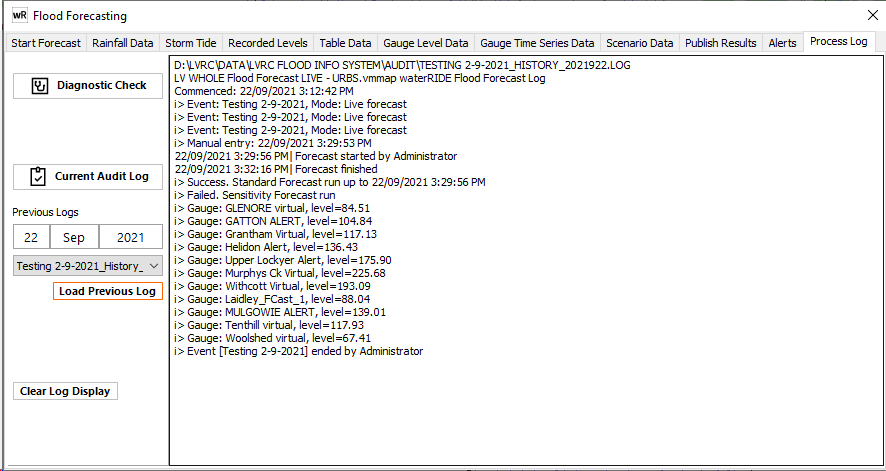
7) PROCESS LOG
Both during and after an event, the audit log can be viewed on the Process Log tab. A Diagnostic check of system configuration can also be carried out.