In recent years natural disasters seem to be increasingly falling into each other, with regular, repeated and severe events occuring "constantly".
Significant effort has been invested into quantifying, from a natural landscape perspective, exposure for discrete risk levels and forms a sound basis from which most risk analysis is carried out.
We can readily identify the impacts associated with these discrete risk surfaces (eg roads flooded, assets affected, properties inundated), but real events rarely, if ever, match these design events, nor align with a round-numbered frequency (such as a 1 in 200).
This leaves us with a significant gap in our analysis, and a significant gap in our understanding. For example, if our asset is affected in a 100yr flood but not in a 50yr flood, where, exactly, is it affected? At the 51yr or the 99yr? There's a large difference!
Vulnerability: Probability of Ground Inundation
What makes more sense is to integrate our analysis across the full probability spectrum of model results available from frequent events such as the 2yr or 5yr through to rare events such as the 1000yr or PMF.
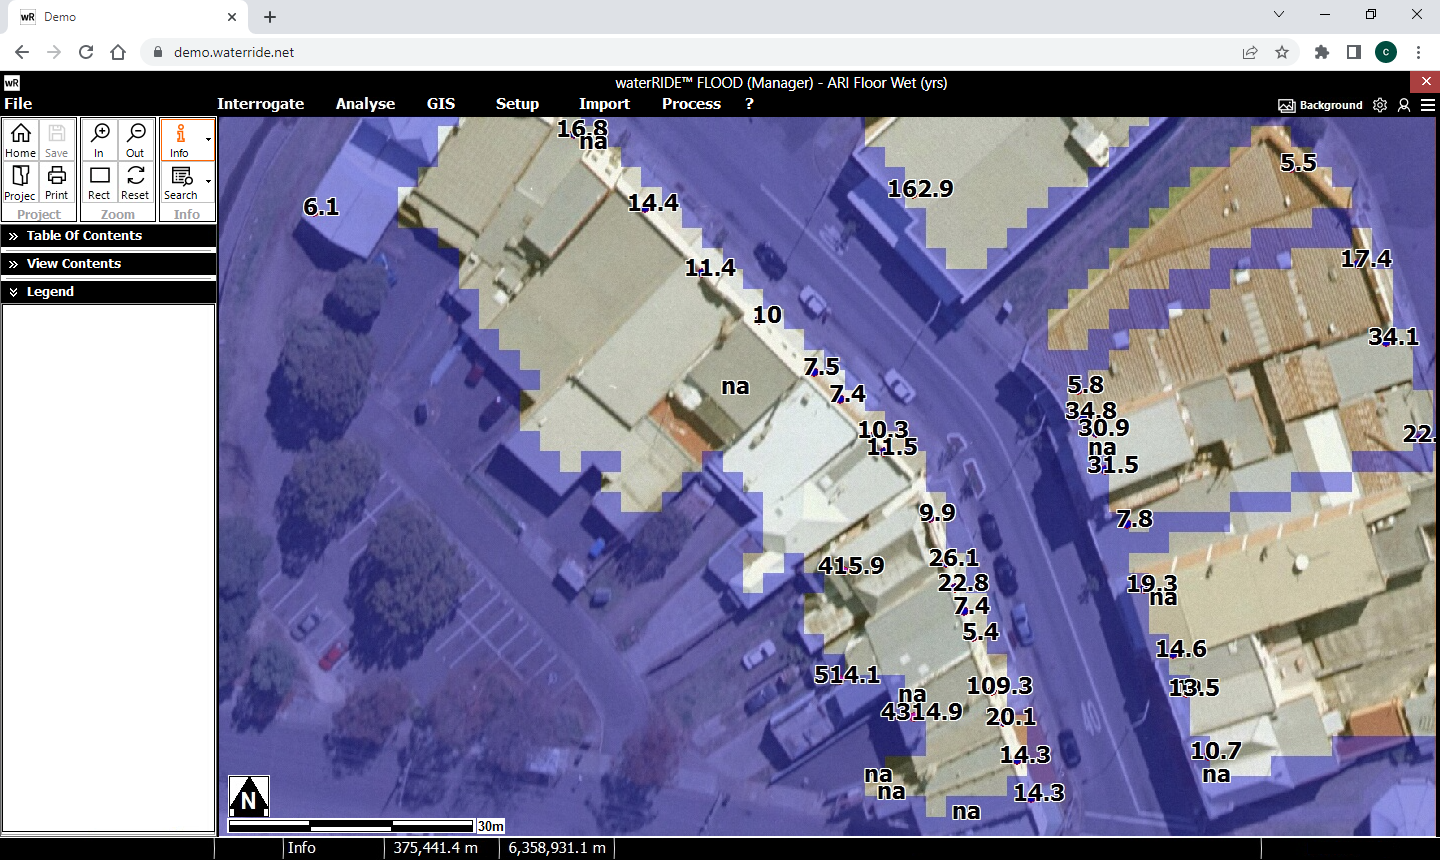
In the first instance, we may wish to determine the probability at which the ground is inundated across the entire floodplain.
Utilising all available flood model results, we can readily calculate this using the Statistics tool on the Analyse panel. The result is the image above, a continuous surface across the floodplain showing the 'exact' probability that the ground is inundated at.
Going one step deeper into a flood intelligence analysis, we can take, say, a GIS layer of property floor levels and calculate the probability that the floor is inundated, as depicted below (Vulnerability tool).
Vulnerability: Probability of Above Floor Inundation
This type of analysis provides tremendous insight into the true vulnerability of a floodplain, site, assets, or community.
It also provides an excellent means to identify those parts of the floodplain most at risk and where mitigation efforts could have significant positive impact.
If you'd like to learn more about the myriad of flood intelligence tools in waterRIDE, browse the online help, book in for a training session, or give as a call.
At our launch of waterRIDE LITE in December we demonstrated how easy it is to make flooding information available to the community.
Designed as a simple means of providing access to flooding information to anyone, we have started using waterRIDE LITE for a wider range of tasks including:
- Community facing flood certificates portals
- Real-time forecast flood information
- Forecast rainfall interrogation and visualisation
- Some of our own waterRIDE demos
More than just "web maps" on your device, the waterRIDE LITE framework provides live access to the data behind the map, allowing you readily interrogate values of, say, depth around your property and start to comprehend the consequences of flooding.
So, what exactly do you need to set up this capability. The answer is, surprisingly little.
A waterRIDE CLOUD plus waterRIDE LITE subscription is all that's needed to share any view in a waterRIDE project.
The appearance of your data in waterRIDE LITE matches any thematic settings seen in your view.
Live linking to the actual flooding datasets is established automatically, with full control over what the end users can interrogate (eg just provide clickable access to depth, or perhaps depth + water level).
Running from our waterRIDE.net servers, the process is seamless, near instant and can be updated/revoked at any time.
Please contact us to discuss your community-facing flood data requirements and keep reading these newsletters, as we've got a host of exciting functionality under development.
waterRIDE CLOUD was first released almost 3 years ago as we entered the COVID19 pandemic.
Since that time it has continued to evolve and now represents a mature, flexible and superior means of accessing and using waterRIDE, no matter your location.
waterRIDE CLOUD is best seen as just waterRIDE, running inside your browser.
You have access to the same rich array of tools, the same powerful interface, with an arguably better experience by maximising the waterRIDE Enterprise settings.
We use it ourselves for our daily workloads and leveraging our powerful cloud servers, the experience is unsurpassed.
We've loaded all of our demonstration projects onto the cloud, which allows us to run them from any internet connected computer, anywhere in the world.
waterRIDE CLOUD also exposes a wealth of additional functionality and capability through additional cloud-only modules and the waterRIDE API framework.
Clearly, we are quite chuffed with the way waterRIDE CLOUD operates in our own consulting projects, and we are confident you'll enjoy the same with your workloads.
Feel free to contact us for more information, arrange a demonstration or explore the demo yourself.
Last newsletter we released a web tutorial taking you through the steps to creating your own Aerials/StreetMaps ImageToggle.
If you missed it, or are not using this capability, we strongly suggest you take a look at the step by step guide here.
Once you've started using ImageToggles, you won't be able to go back!