The thematic tab defines the thematic mapping parameters when a layer is made ‘Active’ or 'thematic'.
The 'active' radio button will be highlighted to denote that the layer is ‘Active’, and the word ‘Active’ will appear beside the layer in the layer list in the Display Panel. Layers can be deactivated by clicking the basic or thematic radio button, or by making another layer ‘Active’. Only one layer can be active at any time. If another layer is made active, the existing active layer will be changed to thematic.
Thematically mapping a layer
GIS files contain information inside data fields (grouped into records) for each object in the layer. Such information might include site numbers or names, elevations, land uses, soil types, water quality, etc. By making a layer ‘Active’, this data becomes available to the user through the main viewing window of the waterRIDE™ interface.
Two different types of GIS field data can be thematically mapped: numerical and category based.
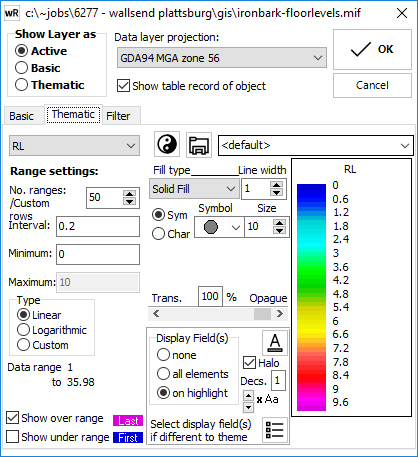
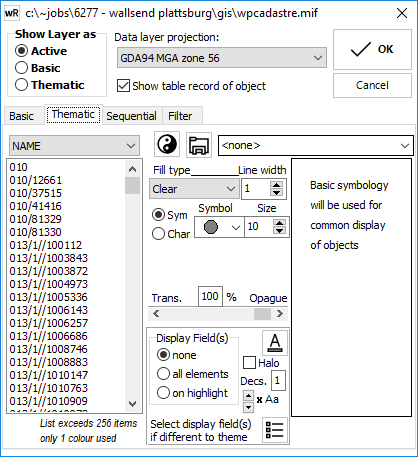
Numerically based thematic mapping (first image) and Category based thematic mapping (second image)
![]() The legend and symbol editor allows the user to create a colour palette for use in colouring a thematically mapped surface. It allows you to select special features (such as symbols rather than standard shapes) for GIS layers which contain point data. This tool also allows you to save the palette so it can be used in other projects (see Legend & Symbol Palette Editor).
The legend and symbol editor allows the user to create a colour palette for use in colouring a thematically mapped surface. It allows you to select special features (such as symbols rather than standard shapes) for GIS layers which contain point data. This tool also allows you to save the palette so it can be used in other projects (see Legend & Symbol Palette Editor).
![]() The ‘load palette’ button allows palettes to be specified for use in the thematic mapping. waterRIDE™ comes with several common palettes and new palettes can be created, edited and saved using the Legend & Symbol Palette Editor. Double clicking in the palette display box to the right will toggle between the selected palette, the built in default palette and no palette. If the palette is set to none for an active layer then the basic symbology is used, while the data remains accessible.
The ‘load palette’ button allows palettes to be specified for use in the thematic mapping. waterRIDE™ comes with several common palettes and new palettes can be created, edited and saved using the Legend & Symbol Palette Editor. Double clicking in the palette display box to the right will toggle between the selected palette, the built in default palette and no palette. If the palette is set to none for an active layer then the basic symbology is used, while the data remains accessible.
Thematic Symbology Panel
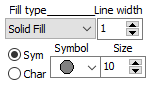
The tools on this panel are used to set the symbology for polygon fill, lines and point styles for objects mapped thematically. The symbol selection tools are available for point data only and allow the user to specify a symbol to use to display the point. Points can be represented by any symbol located in the standard symbol toolbar (Basic tab), or as characters from installed fonts, (such as webdings or wingdings). The symbols will be coloured according to any thematic settings. Setting the palette display box to <none> by double clicking on it will cause the thematic symbology settings to be overridden by the Basic tab settings.
Transparency
![]()
Adjusts the thematic/active layers transparency settings. A value of 40% is a good starting point if you wish the layer to be transparent.
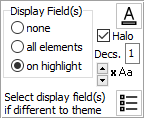
This panel controls how, or whether, data from the thematic field in the active or thematic GIS layer is displayed in the view. The field that is displayed can be selected from the Highlight Field dropdown list (this defaults to the same as the active field) 'Show field value' allows the user to select different options for displaying the active field data in the main map window. There are three different options for displaying active field values; none, all elements or on highlight (i.e. when the user rolls the cursor over an object). The font button can be used to set the font for display of this data and background fill for the font is set with the region fill setting on the Basic tab. A "Halo" can be drawn around the text if selected, which is particularly useful on aerial photography. The 'up/down' arrows control the position of the text when displayed. This may be useful if the user wishes to display the thematic field value from multiple GIS layers. The field chooser ![]() allows you to specify the fields that should be displayed for each object. By default, this is only the active/thematic field.
allows you to specify the fields that should be displayed for each object. By default, this is only the active/thematic field.
Layer Field List
The layer field list provides a drop down list of all fields in the GIS layer. These fields are either categories (text), date or numerical. There are different options that are activated depending on whether a numerical field or category field is chosen as the active field.
Once the active field has been specified, a number of options and settings will appear in the field data panel below the list. These settings are used to control the display properties for the data within the active field.
Numeric Data
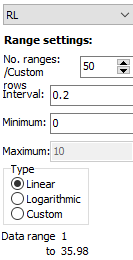
Numeric data is automatically scaled across all the 256 colours in the palette according to the settings specified by the number of ranges (divisions or contours), the contour interval and the minimum value. The maximum value is calculated for your reference. Linear scaling of the divisions across the range is the default, however there is an option to select logarithmic or custom scaling. Custom scaling brings up the adjacent table where the user can enter the minimum and maximum values for each range. There can be numeric gaps between the ranges but they cannot overlap.
Category Data
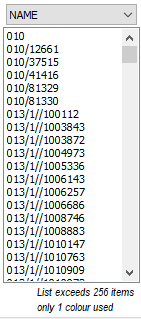
If a category (text) data field is selected the numeric field data panel is replaced with a list of all the unique values in the selected field. This may take a while the first time a field with a large number of objects and not many duplicate values is selected. A .vmcat file is automatically created the first time so that subsequent selections of the field are speeded up.
When mapping category fields, each unique category is assigned a colour from the legend. Character based elements in the layer can be identified with a distinct label or symbol instead of a number. These unique categories may be useful when Linking Files.
NOTES:
- Once a layer is made active, moving the info cursor over the active objects will highlight them. However, data records will not be displayed in the grey status bar unless a data field is chosen using the ‘Thematic’ tab (i.e. waterRIDE™ needs the user to tell it from what column/field to obtain the data).
- It is not necessary to load a palette when a thematic map is chosen. Selecting a palette from the listbox will toggle between <default>, <none>, and other palettes available in your common/project palettes folder. Selecting <default> will use the internal palette and selecting <none> will cause the settings on the Basic tab to be used to define the display symbology for all objects in the active layer.
- Unique values (such as textual labels, e.g. Low, Med and High) versus numerical gradations (real numbers) will be represented differently.
- Numbers stored in a character field will be represented as categories. They must be stored in a numeric field to be automatically scaled across a range.