This tool allows the user to generate multi-criteria reports on a GIS layer (individual reports). Often, these reports will be run against a field in a GIS layer with field values that have been updated using the GIS Intelligence Tool.
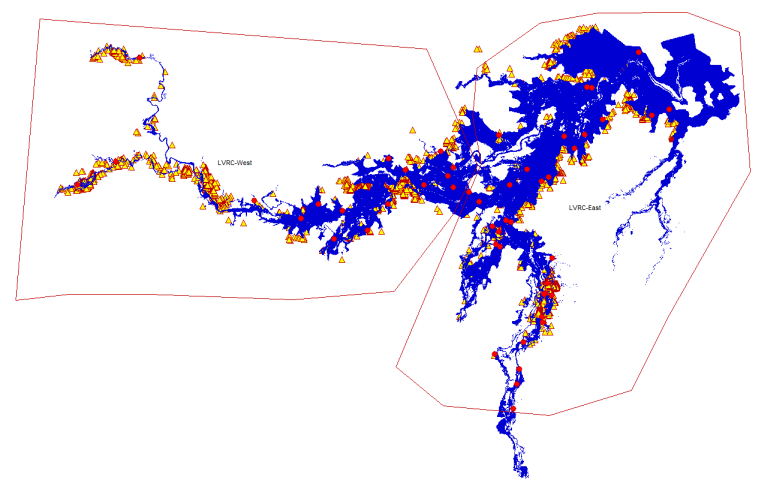
Where multiple reports are to be run, a master report can be generated. This report allows the user to break each individual report into regions (defined in a GIS layer). For example, the master report on the following data would divide the reports on flood affected dwellings (yellow triangles) and flood affected roads (red circles) into two reports: one for the Eastern region and one for the Western.
Alternatively, if a master report is not configured, then each individual report would be run on the entire GIS layer specified for that report.
Reports can either be an Excel Spreadsheet, or in CSV format. Executed reports can be viewed natively by opening the report in Excel, or using the Report Viewer in waterRIDE.
Report configuration is broken into 3 components:
1) Master reporting regions
2) Individiual GIS layer reports
3) The processing script
Configure Master Report
This section is optional and is used to break, what would be, large reports into smaller regions (eg in the above example, breaking the entire Council area into "eastern" and "western" divisions, which may align to the way emergency management resources are deployed). In such a case, the Master report will contain a summary of counts from each individual report within each region. The detail for each report will be included in the individual region reports.
An example summary Master report is provided below:
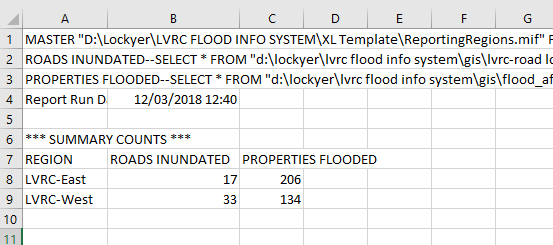
Example Master Summary Report
In the above, the master summary report is showing that in the Eastern region, there are 206 properties flooded and 17 road crossings closed, whilst there are 134 and 33, respectively in the western region.
If not configured, each individual report (section 2), will be run as a standalone report.
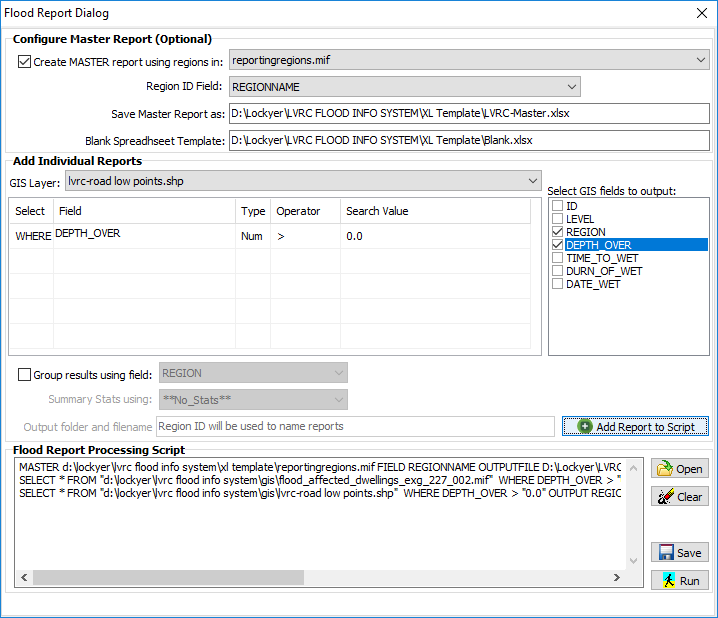
To configure:
1.Select "Create Master reports using regions" tick box
2.Specify the GIS layer (in the project) containing polygons on which to separate processing of individual reports
3.Specify the field containing unique ID's for each polygon. The values in these regions are used in the Master report summary section, as well as becoming the filename of the each individual region report.
4.Specify the Microsoft Excel spreadsheet file (*.xls or *.xlsx) to save the master report to. All individual reports will be also saved to the this folder.
5.Specify a Microsoft Excel blank file to use for reporting. This file may include any general formatting options, logos, headers etc that the user wishes to include in the generated reports.
Configure Individual GIS Layer Reports
An individual layer report is a boolean logic query that is run on a field (or multuple fields) in a GIS layer in the project. If configured within a Master report, the results of these reports will be separated into individual spreadsheets representing each region defined in the Master configuration (each report will be a tab within a single spreadsheet for each region). Otherwise, each report will generate a separate CSV report covering the entire GIS layer.
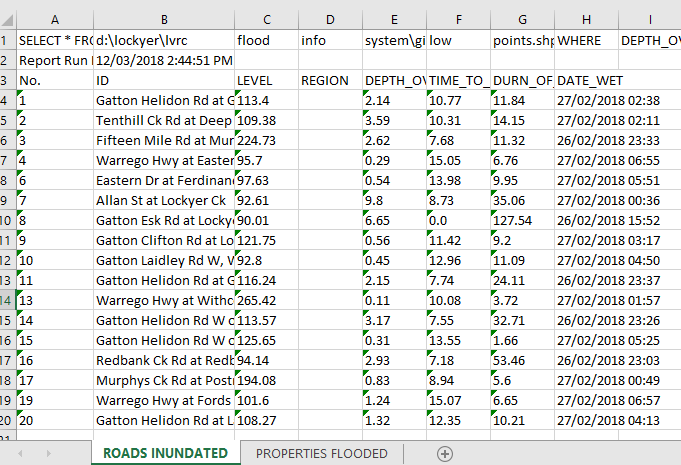
Output spreadsheet for the "Western Region" within a Master Report (note separate tabs for each individual report).
To configure:
1.Select the GIS layer (in the project) to run the query against
2.Enter the report criteria against any combination of GIS field values. Use Boolean AND/OR logic. Use additional WHERE clauses to add mutliple criteria sets, where at least one set must be met for the overall conditions to be considred true (eg (WHERE Depth over floor > 0.5) OR (WHERE Depth over floor > 0.1 AND Velocity > 0.5)
3.Specify any grouping to apply to the data in the report. Grouping allows the user to sort and aggregrate the data according to a field in the GIS layer. For example, a report could be setup to provide a list of all properties that are flooded above floor and grouped into suburbs/towns. If grouping the data, summary statstics can be generated on a field in the GIS layer and will be reported against the values in the grouping field. For example, the following is a report listing properties that are flooded above floor with the statistics calculated on the "depth over floor" field:
** SUMMARY **
SUBURB COUNT MAX MIN AVG
Blackstone 11 3.34 0.09 1.32
Booval 4 2.26 0.28 1.02
Bundamba 209 4.30 0.02 1.21
Silkstone 6 0.93 0.04 0.63
** DATA **
No. HOUSE_NO STREET SUBURB FORE_D_OVR_FLR
1 9991 Thomas Street Blackstone 0.09
2 9992 Thomas Street Blackstone 1.59
3 9993 Thomas Street Blackstone 1.6
4 9994 Thomas Street Blackstone 1.95
5 9995 Thomas Street Blackstone 3.35
6 9996 Thomas Street Blackstone 0.27
7 9997 Thomas Street Blackstone 1.33
8 9998 Mary Street Blackstone 0.53
9 9999 Thomas Street Blackstone 0.95
.....
4.Select the fields from the GIS layer to include in the report (generally, and to enhance clarity, these are only some of the available fields).
5.Specify the output report CSV filename (if running without a Master report), or the "Report Label" if running within a Master report. The report label will be used to label each tab in the output spreadsheets (as shown in the image above = "Roads Inundated" and "Properties Flooded").
6.Click ![]() to add the report to the processing script. Multiple individual reports can be created.
to add the report to the processing script. Multiple individual reports can be created.
7.![]() Save the report
Save the report
8.![]() Run the report
Run the report
The Report Script
Multiple individual reports can be added to any report script (*.vmrep file). A report script can be set to run at the end of a flood forecasting process, if desired.
1) ![]() Open an existing report configuration for editing and execution.
Open an existing report configuration for editing and execution.
An example script is presented below:
MASTER "D:\Lockyer\LVRC FLOOD INFO SYSTEM\XL Template\ReportingRegions.mif" FIELD RegionName OUTPUTFILE "XL Template\Master Report.xlsx" BLANKXLSX "XL Template\Blank.xlsx"
SELECT * FROM "d:\lockyer\lvrc flood info system\gis\lvrc-road low points.shp" WHERE DEPTH_OVER > "0" OUTPUT ID,LEVEL,REGION,DEPTH_OVER,TIME_TO_WET,DURN_OF_WET,DATE_WET AS "Roads Inundated"
SELECT * FROM "d:\lockyer\lvrc flood info system\gis\flood_affected_dwellings_exg_227_002.mif" WHERE DEPTH_OVER > "0" OUTPUT LOT_PLAN,ASSESSMENT,PARCEL_ADD,PARCEL_POS,FEATURE,STREET_NAM,LOCALITY,LONG,LAT,GROUND_AHD, LVENV_E10P_234_H_1,LVENV_E50P_227_H_1,LVENV_E100P_227_H_1,LVENV_E500P_227_H_1,LVENV_E2000P_227_H_1,LVENV_PMF_250_241_H_1,DWELLING_TYPE,FLOOR_HEIGHT,FLOOR_HEIGHT_AHD,ADD_UPPER,DAF_E10P,NOTES,DEPTH_OVER AS "Properties Flooded" GROUPBY LOCALITY **No_Stats**