The Link to Gauge Level tool provides an alternative approach to integrating GIS information with a water surface. It operates in one of two ways:
1) Time Varying Water Surface: allows the user to determine the gauge level at the time that the level in the specified field of a GIS layer is first reached. This may be useful for determining the gauge level at which: Evacuation routes are cut, Properties are flooded above floor, Critical infrastructure becomes inoperable etc. This is calculated against a single, time varying flood surface.
OR
2) Peak Water Surfaces: allows the user to determine a static gauge level at which the field is expected to be inundated. This is calculated across a range of peak flood surfaces (small to large), in a similar manner to the surface interpolation used in flood forecasting.
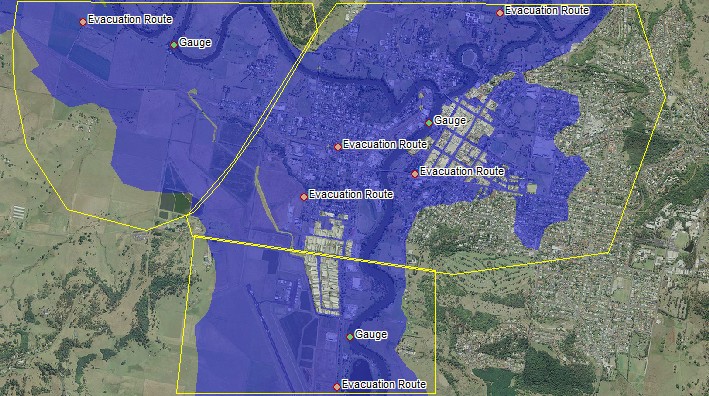
For option 1, a time-varying water surface is used to determine the timestep at which the critical level in the GIS file is reached, for all points in the layer. It then reads the water surface at the corresponding gauge for that timestep. If multiple gauges are to be used, a GIS file of polygons sets out how the gauges link to different parts of the floodplain, as shown below.
For option 2, a library of peak water surfaces are used to determine the equivalent gauge level at which the critical level in the GIS file is reached, for all points in the layer. It first reads peak water levels for all surfaces selected at the gauge(s). It then reads the peak water surface values at each point in the GIS layer. Identifying the peak surface above and below the critical level, it then determines the ratio of the critical level between these two surfaces. The ratio is then applied to the corresponding gauge location and the gauge level interpolated. Note that all surfaces must be stretched to the extents of the next highest surface to enable interpolation to occur. Extrapolation beyond the library of peak surfaces is not possible.
All layers used in the analysis must be in the current project.
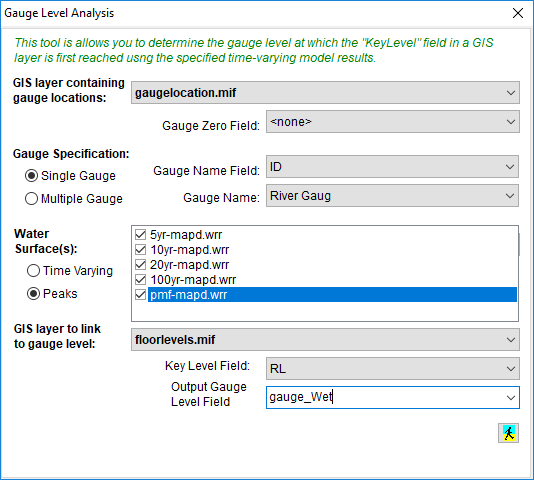
GIS Layer Containing Gauge Locations: Specify the GIS layer containing the gauge locations. If there is a difference between the water surface vertical datum and the gauge vertical datum, you can specify a field in the GIS layer that contains the gauge zero value (eg a model is in AHD, but the gauge is in a local datum). The gauge zero will be subtracted from the water surface value to provide the level in local gauge datum.
Gauge Specification: If using a single gauge, select the field containing the gauge names and then select the name of the gauge to use from the list. If using multiple gauges, specify the GIS layer containing the polygons defining which gauge to use in different parts of the catchment. When processing, a gauge is assigned to the polygon it resides in (there is no need to specify which polygon applies to each gauge).
Water Surface: 1) TIME VARYING - Specify the time-varying water surface to use in the analysis.
2) PEAKS - Select the surfaces to use in the interpolation. If the critical level is above the highest water surface, a value of "N/A (-9999.99) will be assigned to indicate the critical level is not inundated. If the critical level is below the smallest water surface, a value of 0 will be assigned.
GIS Layer to Link to Gauge Level: Specify a GIS layer of points which are to be linked to the gauge levels. A Key Level field defines the level at which the object is considered "flood affected". Once this level is exceeded at the point, the corresponding level at the gauge will be stored in the Output field. If this key level does not exist, then it can be created by assigning the terrain level at the point using the GIS-Flood Integration tool.