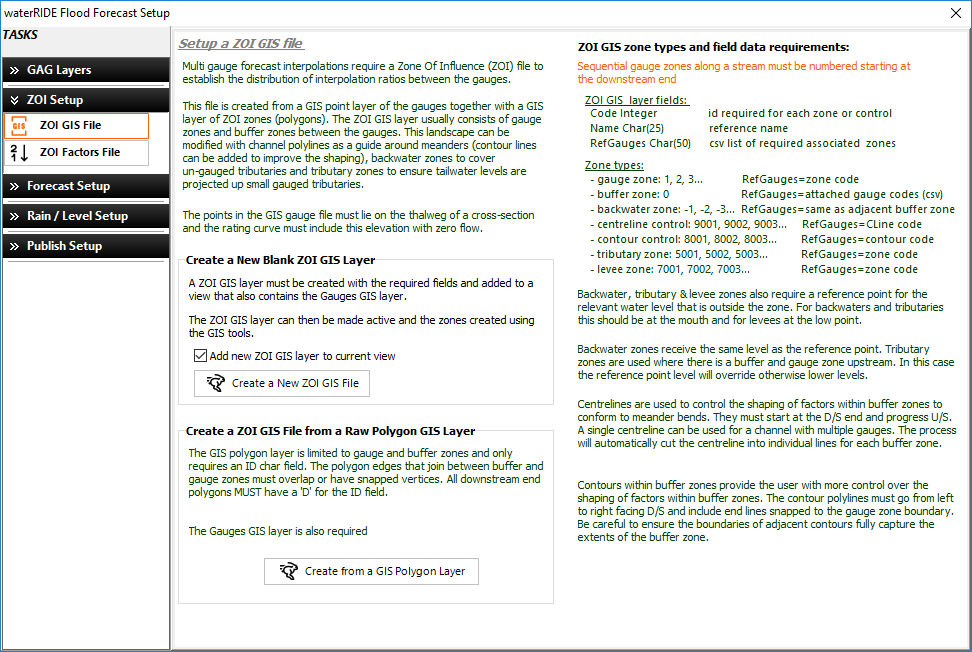
A Zones of Influence factors file is required when running a multi gauge surface interpolation to enable bending or warping of the surface to suit differing intensities along a river or between tributaries. A ZOI GIS file must first be created to define the necessary zones and identify the linkages.
The ZOI GIS Layer contains the zones of influence for each gauge (gauge zones), as well as the buffer zones between gauge zones, and backwater and tributary zones attached to buffer zones. It is a GIS layer containing regions representing each gauge zone and as many buffer, backwater, tributary, and levee zones as necessary. To avoid discontinuity in water surfaces, there should always be a buffer zone between gauge zones, and zones should overlap slightly along common edges. The GIS file used by waterRIDE™ to create a Zones Of Influence file (zoi). The ZoI GIS layer can be created manually, or automatically if using a simple gauge zone/buffer zone configuration.
Manually Creating a ZoI GIS Layer:
A ZoI GIS layer can be created in waterRIDE™ or any GIS package. The structure of the file must be as follows:
Field 1 CODE (Integer) Sequentially numbered gauge ID's (starting at 1) from downstream to upstream as per the "Zone Type" codes on the screenshot above. Set to 0 for a buffer zone.
Field 2 GAUGENAME (Char) Name of gauge inside the gauge zone (must match exactly). Set to "Buffer Zone" for a buffer zone.
Field 3 REFGAUGES (Char) Comma Separated List of Gauge Codes buffer zones apply to. Set to the same as Code for a gauge zone.
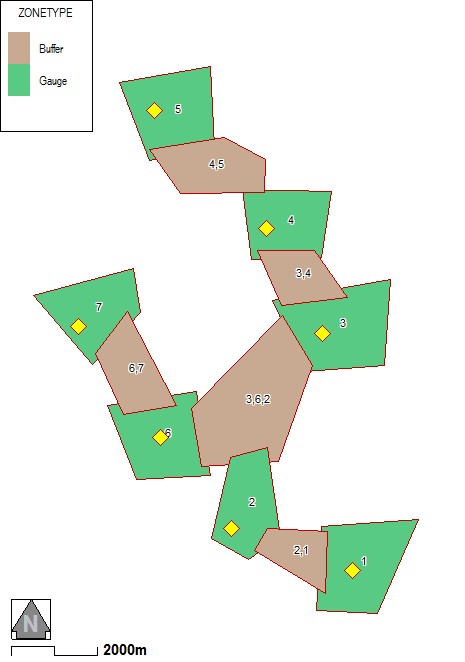
An example Zones of Influence GIS file is provided below, with the downstream end being the zone at the bottom left. Gauges are yellow diamonds. Gauge Zones are shaded green. Buffer Zones are shaded brown. Gauge zones must contain only gauge. Buffer Zones must intersect with at least two Gauge Zones. Buffer Zones cannot contain any gauges.

CODE for a ZoI GIS layer. Note sequentially increasing numbering from the start of each "downstream end".
REFGAUGES for a ZoI GIS layer. Note each Gauge Zone only references itself.

GAUGENAME for a ZoI GIS layer. Note each Gauge Zone matches exactly the name field in the GIS gauges layer.
Automatically Creating a ZoI GIS File
A ZoI GIS file can be created using a GIS file of appropriately structured polygons, along with the GIS gauges layer (points). This only applies to a simple multi-gauge configuration consisting of buffer and gauge zones only. The polygons should be setup as follows:
1) A gauge zone can contain only one gauge
2) A buffer zone must intersect at least two gauge zones.
3) A buffer zone cannot contain any gauges
4) The downstream ends of each "ZoI branch" must be marked with a "D" or 'd' in a field.
Once created, the raw ZoI GIS layers can be processed into a formatted ZoI GIS layer using the "Create Using Existing Polygons GIS" tool.

Creating the ZoI File
The second part of the process, once the ZOI GIS layer has been completed is to generate the ZOI factors file.
1) In the "Create the ZOI Factors File" box, Select the Stream GIS layer. This is the layer that will be used in the forecast setup to define the multiple gauges that are being used. There must be an exact correlation between the gauge names used in the ZOI Factors file and the gauge names used for the forecasting.
2) Select the name filed from the gauges GIS layer.
3) Select the ZOI GIS layer created above.
4) Select any of the forecast surfaces (library surfaces or interpolated).
5) If a stream centreline has been used set the buffer distance.
6)Select a location and name to save the ZOI Factors file to.
7) Click the Run ![]() button to execute the process.
button to execute the process.
8) When the process has finished, a series of binary raster grids can be created to enable the ZOI factors across the buffer zones to be viewed.