If external gauge data is to be used in a waterRIDE™ flood forecasting system, a gauge (*.GAG) layer must be configured. A GAG layer provides a link between external gauge data and waterRIDE™.
GAG layers usually contain time series river levels, rainfall amounts or storm tide levels for any number of gauges, as well as some general information about the gauge. GAG layers can also be setup to contain the outputs of hydrologic models such a modelled flows or levels.
Only a single type (rain, level or model) of gauge can be included in a single file. Generally, a river based forecasting system will usually have one GAG layer for rainfall, and another for river levels, with optional Model output gauges if a real-time hydrologic modelling system has been configured. For a storm tide system, there may be three GAG layers: the expected gauge levels and an upper and lower bounds GAG layer (generally from ensemble modelling).
Note that for a water level gauge (physical river gauge), all readings are stored to a national geodetic height datum (eg AHD in Australia), with a local gauge datum (or gauge zero) being used to convert between gauge readings (stage) and actual water level (level).
Normally, external gauge data is retrieved automatically using waterRIDE FORECAST Console.
Select Forecast->Gauge Layers->Create New Gauge Layer
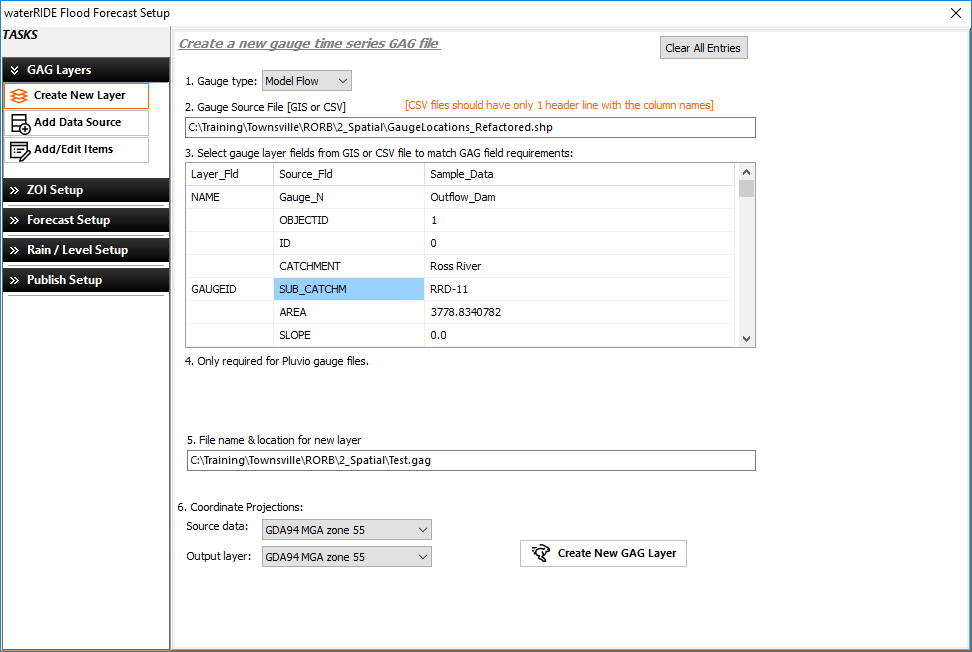
1) Select the GAG layer gauge type: Pluvio/Water Level for physical gauges or Model Level/Model Flow for Model outputs or Model Rain for Model rainfall input (sub-catchment based hyetographs as input into the model)
2) Select the GIS layer or CSV containing information about the gauge. As a minimum, for each gauge this must include:
•Gauge Name - Gauge name identifier. For labelling purposes only.
•Gauge ID - Unique gauge ID - can be used for cross referencing between GAG layer and its datasource (eg Enviromon)
•CommsID - Unique communications ID number for the gauge - can be used for cross referencing between GAG layer and its datasource (eg Enviromon)
•X/Y Coord - Required if a CSV file is used. Coordinates read directly from the GIS layer otherwise.
•For Water Level gauges, additional fields can be specified:
- Datum - adjustment to subtract from gauge stage readings to convert them into water levels. Commonly referred to as gauge zero.
- Minor/Moderate/Major - water levels for relevant flood, in national height datum
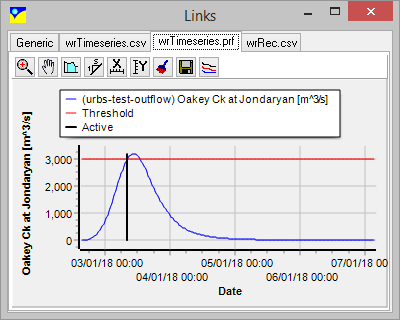
•For Model Flow gauges, an additional "Threshold" flow can be specified (such as the flow at which a road is overtopped). This value is used to draw a red horizontal line on the flow plot, as shown below. If this value is less than 0, no line will be displayed.
3) Assign the above fields to relevant label from the dropdown list
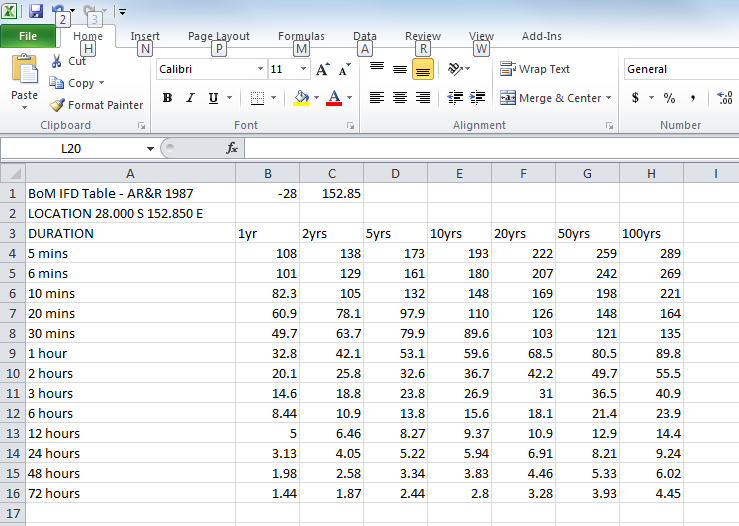
4) Select the BoM IFD table to use for the GAG layer (Pluvio or Model Rain only). This allows general ARI statistics to be calculated for the recorded rainfall over varying time windows. In Australia, this can be collected directly from: http://www.bom.gov.au/water/designRainfalls/ifd/
An example file is provided below:
5) Enter the location to save the GAG layer to.
6) Select the coordinates of the source gauge location information and the output GAG layer. If reprojection is required, these should be different.
7) Click "Create New layer"
Linking A GAG Layer to a Datasource
Once setup, a GAG layer must be linked to a datasource in order to populate it with gauge readings. Select Forecast->Gauge Layers->Add Gauge Readings.
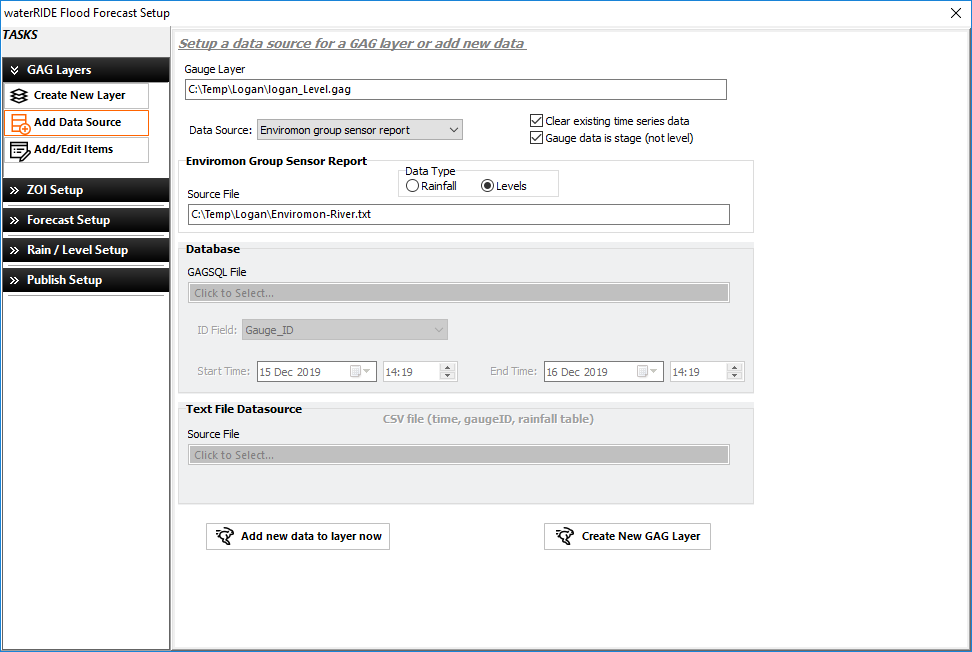
1) Select the GAG layer to populate
2) Select the Data Source Type (Enviromon, Database, CSV file, URBS output, BoM HCS file, or another GAG layer) according to the source of the gauge data.
3) Tick the Clear Existing Time Series Data box if you wish to delete existing data in the file. If importing river gauge readings from an Enviromon group sensor report, you can specify if the readings are in gauge datum (stage). The default option is that readings are in a national geodetic height datum (eg AHD in Australia). If readings are to a local gauge datum, then the "datum" for each gauge will be added to all readings as they are imported.
4) If using a Text File (CSV), specify the location of the text file. The first line of this file is the header line. The first cell of this line is ignored, with subsequent cells being the gauge ID (or CommsID or GaugeName) for each gauge in a separate column. The gauge time series data is then defined by row, with the first cell being the full date time. An example file format follows (should be comma separated):
TIME 1566 5549 6711 5515 4132 1993
1/05/2015 22:00 0 0 0 0 0 0
1/05/2015 21:55 0 0 0 3 0 1
1/05/2015 21:50 0 1 0 0 0 0
1/05/2015 21:45 0 0 0 2 0 0
1/05/2015 21:40 0 0 0 0 0 0
1/05/2015 21:35 0 0 3 0 0 4
1/05/2015 21:30 0 0 4 0 0 0
1/05/2015 21:25 0 0 1 0 0 0
5) If linking to Enviromon data, specify the location of the relevant Group Sensor Report output file.
6) If linking to a database, specify the location of the GAGSQL file.
7) Select Add New Data to Layer Now to collect information from the datasource
8) Select Add Layer Source to Setup to save the configuration to the project file for repeated data collection
Linking a GAG Layer to a CSV file
A GAG layer can be linked to a CSV file. The first line of this file is the header line. The first cell of this line is ignored, with subsequent cells being the gauge ID (or CommsID or GaugeName) for each gauge in a separate column. The gauge time series data is then defined by row, with the first cell being the full date time. An example file format follows (should be comma separated):
TIME 1566 5549 6711 5515 4132 1993
1/05/2015 22:00 0 0 0 0 0 0
1/05/2015 21:55 0 0 0 3 0 1
1/05/2015 21:50 0 1 0 0 0 0
1/05/2015 21:45 0 0 0 2 0 0
1/05/2015 21:40 0 0 0 0 0 0
1/05/2015 21:35 0 0 3 0 0 4
1/05/2015 21:30 0 0 4 0 0 0
1/05/2015 21:25 0 0 1 0 0 0
Linking a GAG Layer to Enviromon - Configuring an Enviromon Group Sensor Report
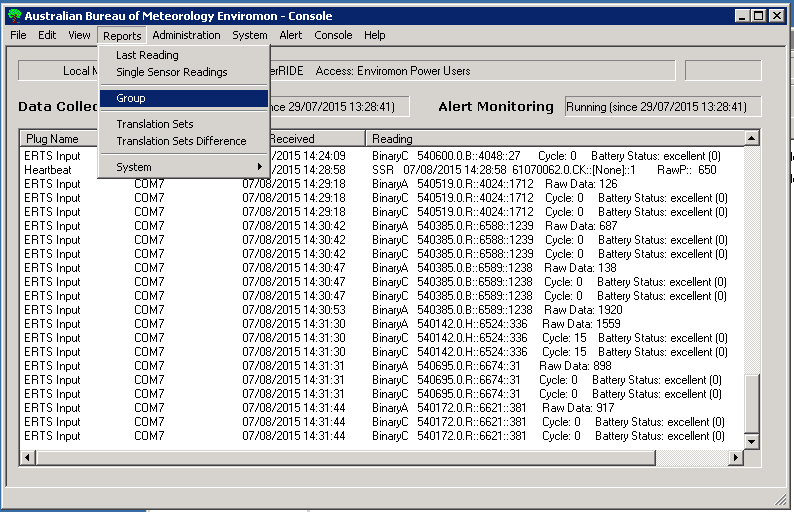
Open the Enviromon Console application and select Reports->Group.
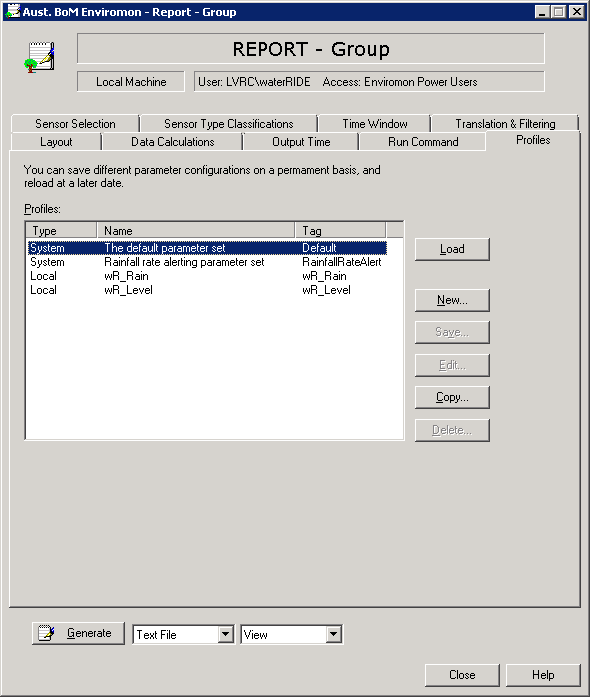
On the Profiles Tab, select New and enter and appropriate ID and description (commonly wR_Rain or wR_Level)
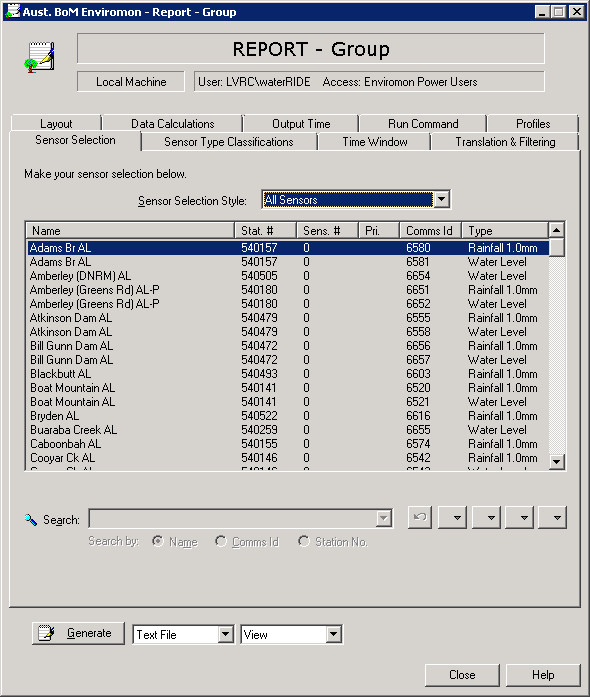
On the Sensor Selection Tab, select All Sensors
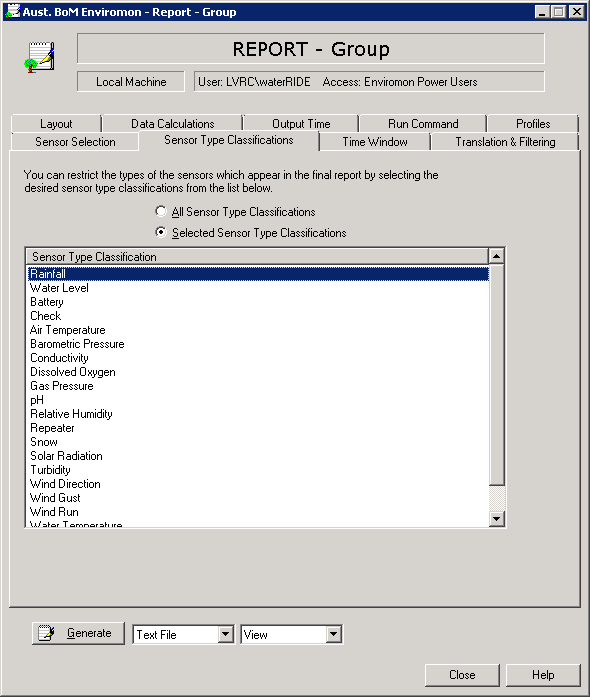
On the Sensor Type Classifications tab, select Rainfall or Water Level, as appropriate. Only one sensor type can appear in the report.
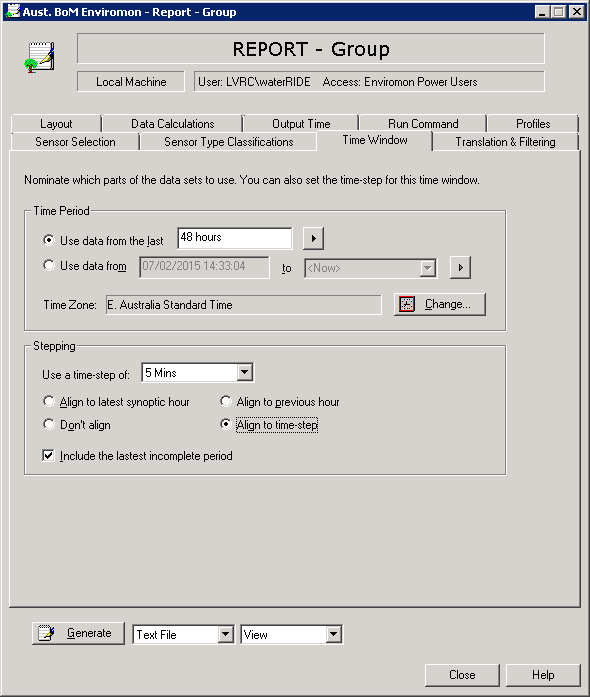
On the Time Window Tab, select a suitable time period of the last XXX hours. Select a suitable timestep and ensure that the timestep "stepping" is set to Align to Time-Step
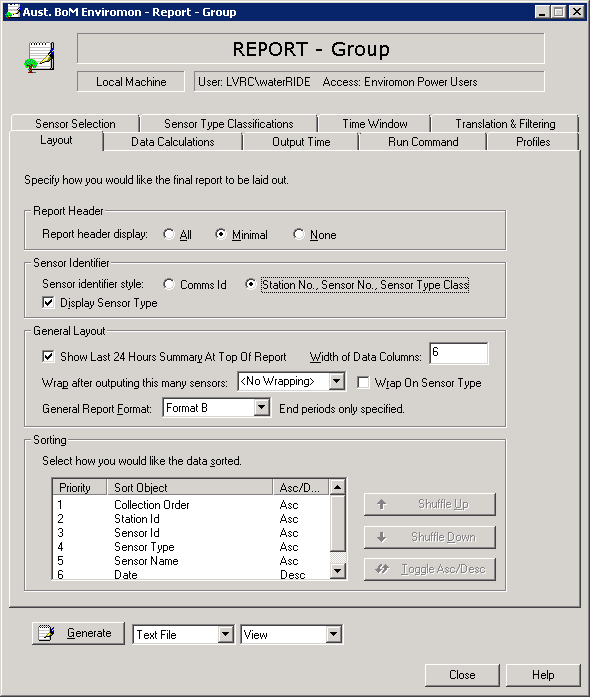
On the Layout Tab, select whether to use the CommsID or Station No,Sensor No., Sensor type Class as the ID to cross reference to the GAG layer.
On the Profiles Tab, click Save to save the sensor report.

Batching an Enviromon Group Sensor Report
A windows scheduled task can be setup to automatically run a Group Sensor Report at regular intervals. Generally, it is simplest to create a regular windows batch file (*.bat) that contains the command to extract the report, and then schedule the execution of the batch file.
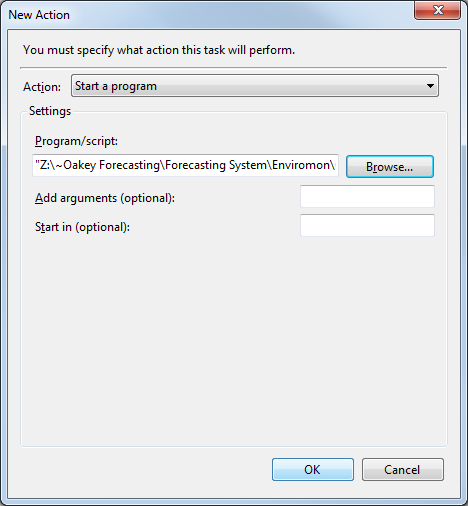
The batch file should contain the path to the Enviromon Reporting Executable, as well as parameters containing the ReportID to run and the location to save the report output. An example is provided below (the fields highlighted in bold should be changed to match you system setup:
"d:\Australian Bureau of Meteorology\Enviromon\NetBase\NetClient\Bin\EM_Report_Group.exe" /Automated /ProfileTag "wR_Rain" /OutputMethod WriteToDisk "E:\Enviromon Profile Reports\Enviromon-Rainfall.txt" /DfltConnTag LOCAL_MACHINE
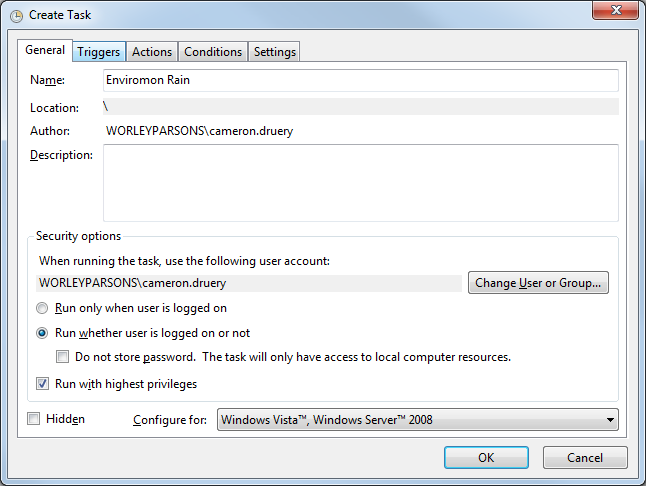
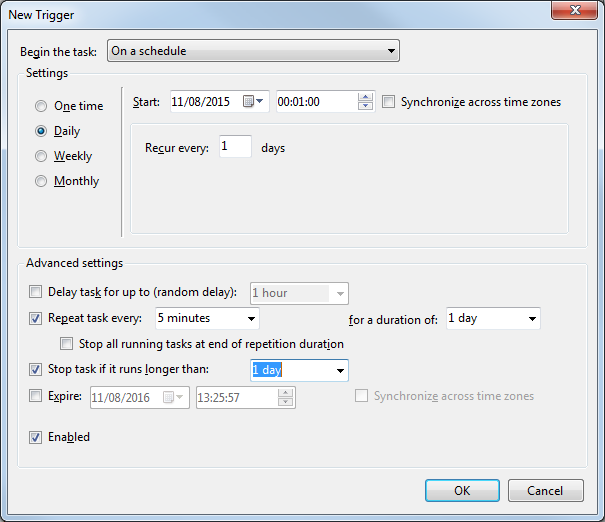
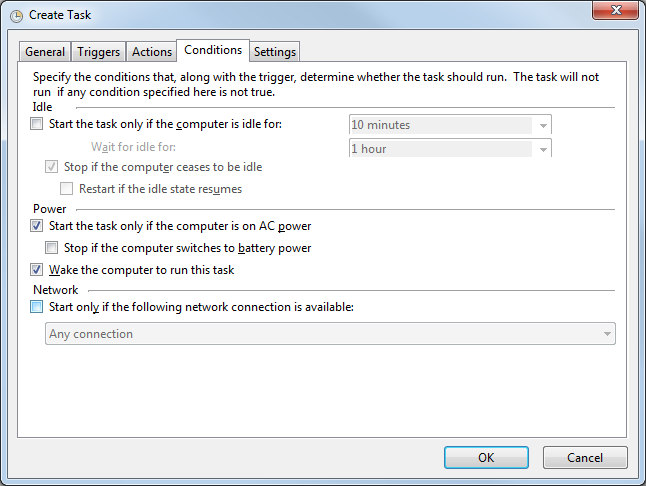
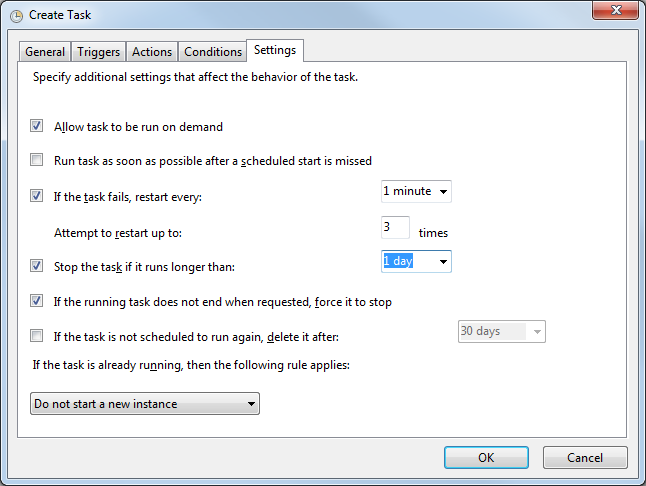
Once a batch file has been created, a Windows Scheduled Task (Task Scheduler) should be created. Some example settings are provided below:
Linking a GAG Layer to an SQL Database - Creating a GAGSQL Layer
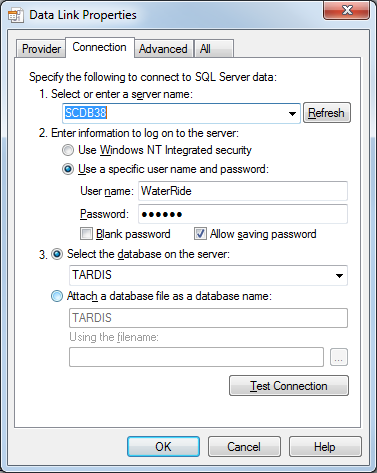
A GAG layer can be linked to information inside a database. A UDL connection file must be created for the database and a suitable SQL/Stored Procedure coded to extract the required information. Essential result fields in the resulting table are the GaugeID for each row (directly matching the unique CommsID or GaugeID in the GAG layer configuration) and the output value to include in the GAG layer (eg rain, level, ARI etc).
An example UDL configuration is provided below:
The following GAGSQL file provides an example of running a stored procedure in a TARDIS system that returns gauge-based ARI's for use in forecasting:
Debug: True
UDL file: TARDIS.udl
Queries: EXEC spExternalWaterride @StreamPointList @DateTo @HoursDuration @CurrentWeightings @LossesPerHour @MetEyePercent
Result Fields: ID=StreamPointID VALUE=ARI
End
Notes:
StreamPointList = csv list of TARDIS IDs
DateTo = End date for retrieval 'dd mmm yyyy hh:nn'
HoursDuration = preceding hours over which to get the ARI
HoursDuration= 0= using historical weightings
LossesPerHour= -1= using calculated losses per hour
MetEyePercent = Bom PME precip percent (10, 25 or 50)
Results table fields: StreamPointID, IFD, ARI, ARI_1yr, ARI_2yr... 20yr, 50yr, 100yr, 200yr, 1000yr, 2000yr