The surface interrogation tools allow you to "slice and dice" a surface (both peak and time-varying). These tools also combine with the Info Tool (![]() ) for surface inspection.
) for surface inspection.
The surface tools provide access to:
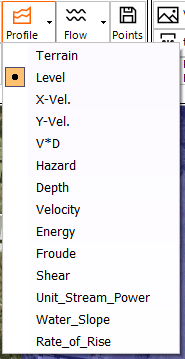
![]() Time-Series Plot: Extract a time series plot(s) by left clicking on the map window. The plot will default to the active parameter. The dropdown menu allows you to select any available parameter to plot. The plot will display in the Links Window.
Time-Series Plot: Extract a time series plot(s) by left clicking on the map window. The plot will default to the active parameter. The dropdown menu allows you to select any available parameter to plot. The plot will display in the Links Window.
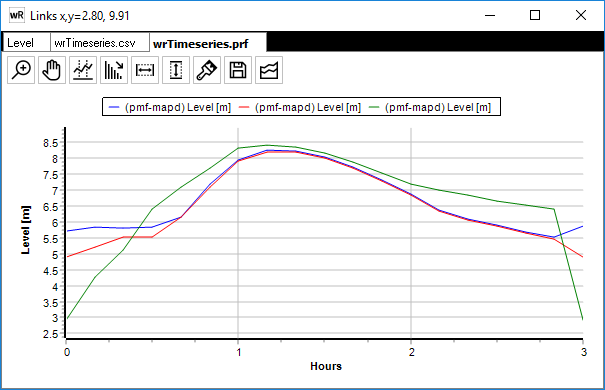
Example time series plot at three locations.
![]() Profile Plot: Extract a profile plot along a line drawn by left clicking on the map window. The plot will default to the active parameter. The dropdown menu allows you to select any available parameter to plot. The plot will display in the Links Window.
Profile Plot: Extract a profile plot along a line drawn by left clicking on the map window. The plot will default to the active parameter. The dropdown menu allows you to select any available parameter to plot. The plot will display in the Links Window.
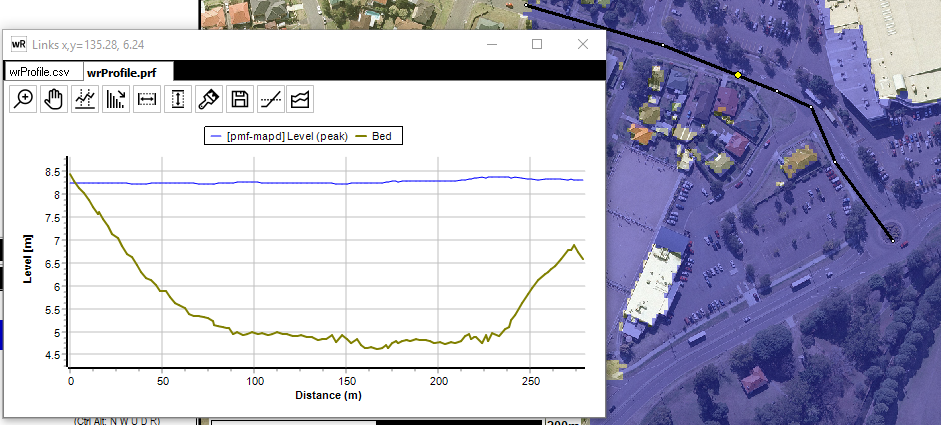
Example profile plot along section line (black)
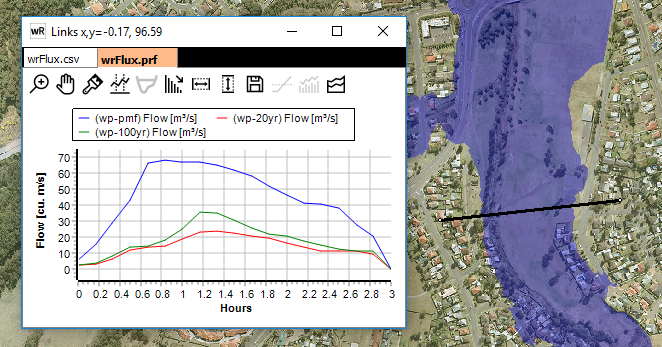
![]() Flow Plot: Extract a hydrograph across a line drawn by left clicking on the map window then right clicking when finished (at least 2 left clicks must be made). Additional flow sections can be drawn as required. The value of the flow (peak or for a specific timestep) will be displayed next to the cross section.
Flow Plot: Extract a hydrograph across a line drawn by left clicking on the map window then right clicking when finished (at least 2 left clicks must be made). Additional flow sections can be drawn as required. The value of the flow (peak or for a specific timestep) will be displayed next to the cross section.
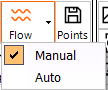
The dropdown menu allows you to access the auto flow tool. In this mode, a single left click will automatically define a flow section by moving away from the point normal to the flow direction (velocity vectors). The plot will display in the Links Window.
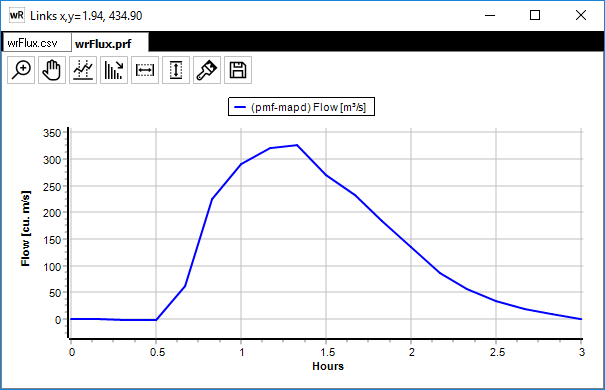
Example flow plot
![]() Save Points: If the Links Window is visible, the points and tool mode clicked to create the relevant time/profile/flow plot plot will be saved to a waterRIDE points file (*.pts) to enable that links window to be "recreated" at a later date. The points file saves the point(s) that were clicked, as well as the tool that was used. A simple GIS (MIF/MID) file will also be saved.
Save Points: If the Links Window is visible, the points and tool mode clicked to create the relevant time/profile/flow plot plot will be saved to a waterRIDE points file (*.pts) to enable that links window to be "recreated" at a later date. The points file saves the point(s) that were clicked, as well as the tool that was used. A simple GIS (MIF/MID) file will also be saved.
![]() Load Points: When the Links Window is not visible, this button can be used to open an existing points file (*.pts) or external GIS file (mif, tab, shp, kml). When opening a points file (*.pts), waterRIDE will automatically recreate the link window from which the pts file was saved, using the active surface. For example, a profile plot may have been saved using the 100yr flood. This points file could then be used to extract a profile plot along the same line for the 50yr by opening the points file on a view with the 50yr layer active.
Load Points: When the Links Window is not visible, this button can be used to open an existing points file (*.pts) or external GIS file (mif, tab, shp, kml). When opening a points file (*.pts), waterRIDE will automatically recreate the link window from which the pts file was saved, using the active surface. For example, a profile plot may have been saved using the 100yr flood. This points file could then be used to extract a profile plot along the same line for the 50yr by opening the points file on a view with the 50yr layer active.
When opening a GIS layer using the Load Points tool, waterRIDE will ask you how the file should be used. For example, a GIS file of points could be used to extract time series plots of depth at each point in the file or to display keypoints. Alternatively, a GIS file of polylines could be used to extract profile plots of water level.
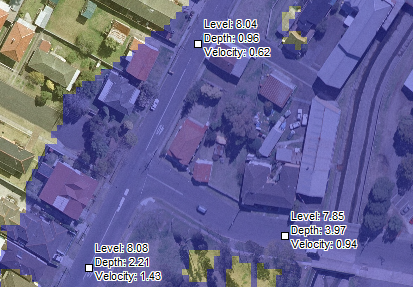
![]() Add Key Points: Allows you to display the active surface value by clicking at any location on the surface. This can be particularly useful to highlight specific or key flood behaviour for figures or community education. The active surface value will be displayed by default. Clicking the dropdown arrow allows you change this to any number of the available parameters for the active surface (simply tick all desired items). The display font/style/colour can be specified on the Layer Display form for the active layer, including the selection of multiple field values. Text size and halo settings can also be adjusted on the FASTBAR.
Add Key Points: Allows you to display the active surface value by clicking at any location on the surface. This can be particularly useful to highlight specific or key flood behaviour for figures or community education. The active surface value will be displayed by default. Clicking the dropdown arrow allows you change this to any number of the available parameters for the active surface (simply tick all desired items). The display font/style/colour can be specified on the Layer Display form for the active layer, including the selection of multiple field values. Text size and halo settings can also be adjusted on the FASTBAR.
![]() Clear Key Points: Key points can be cleared by clicking this button. The tool operates in one of two modes, as set by from the dropdown part of the button:
Clear Key Points: Key points can be cleared by clicking this button. The tool operates in one of two modes, as set by from the dropdown part of the button:
•One by One - allows the user to left click on the keypoints to be deleted
•All - deletes all key points.
The default mode of operation is to clear all keypoints, consistent with v8.
![]() Repeat Last: Repeats the last surface interrogation operation on the current view. For example, if keypoints were added to a view, then the user changes to a different view, pressing Repeat Last will add the same keypoints to the current view. Similarly for time series, profile, or flow plots.
Repeat Last: Repeats the last surface interrogation operation on the current view. For example, if keypoints were added to a view, then the user changes to a different view, pressing Repeat Last will add the same keypoints to the current view. Similarly for time series, profile, or flow plots.
![]() Volume: Allows you to calculate surface volumes/areas within:
Volume: Allows you to calculate surface volumes/areas within:
•a user drawn polygon
•polygon within a layer in the view
•the entire surface
Volumes are usually defined in terms of totals above/below a specified datum. If level or depth are active, it will calculate the volume of water.
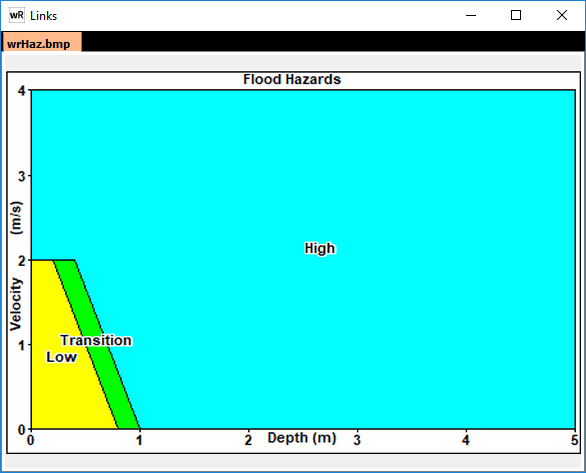
![]() Hazard/Risk Profile: Will display the hazard and risk profile (if used) for the active surface.
Hazard/Risk Profile: Will display the hazard and risk profile (if used) for the active surface.
Working With The FASTBAR and Surface Tools
When a water surface is active, the FASTBAR can be used to interrogate multiple water surfaces in the project at once. Simply select the desired water surfaces in the FASTBAR and any surface tool can be used to interrogate all of the selected surfaces.
For example, the plot below shows a flow plot extracted at one location for the selected flood surfaces: