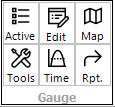
If a gauge (GAG) layer is active, the Gauges tools provide access to gauge management tools. These tools are in addition to the time series tool on the surface interrogation toolset.
waterRIDE™ allows the user to extract plots of point-based, time-varying "gauge" data from gauge layers (*.gag) - a "GAG" Layer
Generally, a GAG layer will contain information relevant to:
•Water level gauges:
- Level
- Stage
- Rate of Rise
- ARI of level
•Rainfall gauges
- Rain over period/selected window
- Peak burst rain intensity over selected window
- ARI of rainfall (over various periods)
•Hydrology model outputs
- Modelled flow
- Modelled stage/level
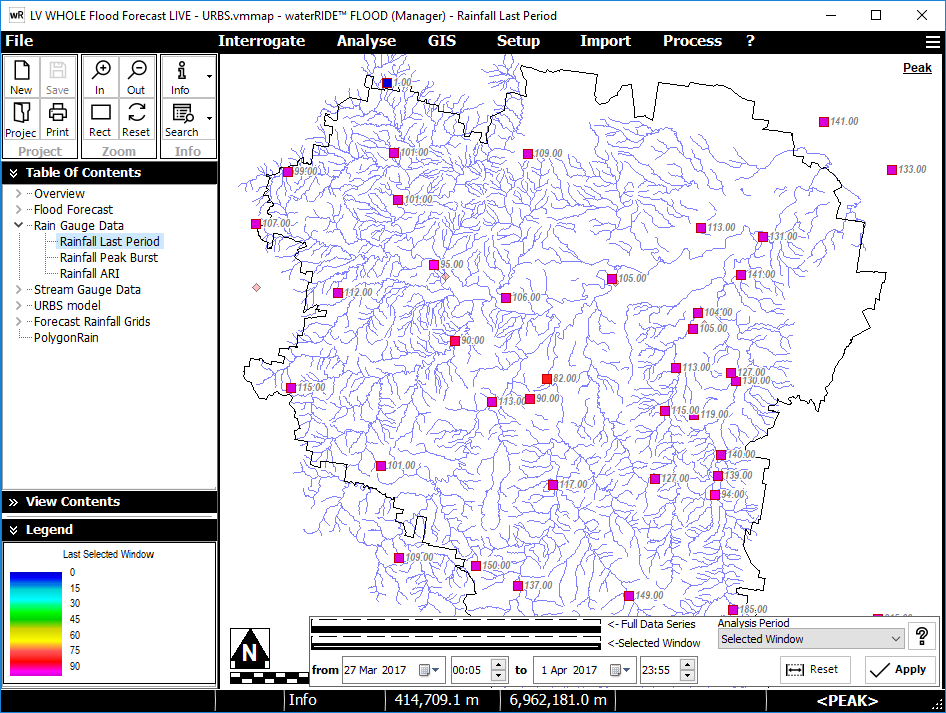
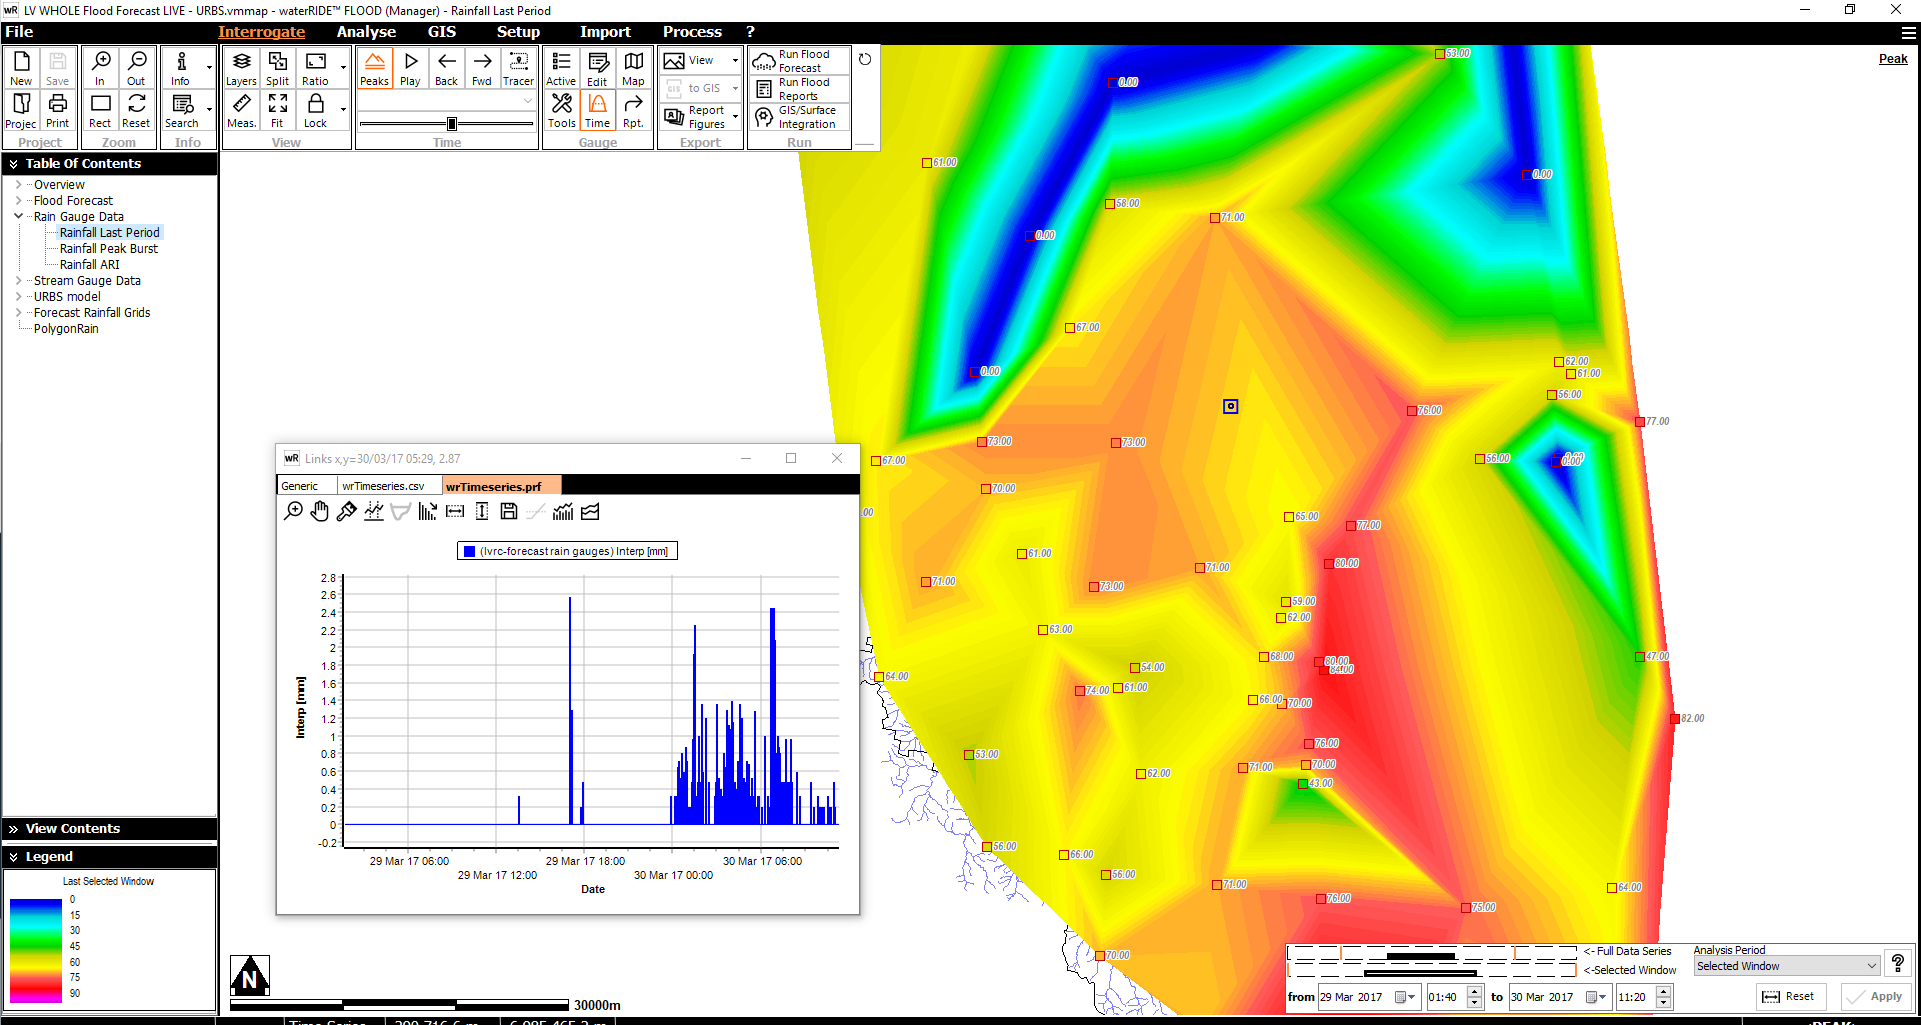
Example rainfall gauge layer showing total rain in the selected time period.
If a gauge layer is made active, it can be interrogated in the same way as a water surface using the following tools:
• time series plot
•point inspection
Additional Gauge Layer Only tools also become available:
•Selecting a specific time window
•Generate Summary of Gauge Data (rainfall and river level gauges only)
•Show TIN Surface of Rainfall (rainfall gauges only)
•Edit Gauge Header information
Select a Specific Time Window (Rainfall and River Level Gauges Only)
When working with gauge data, lengthy periods of record may be included in the layer. This tool allows the user to define a specific time period within the layer to limit interrogation to, the active time window. This is limited to working with Rainfall and River level gauges. In flood forecasting mode (either LIVE or TRAINING), the tools available on the panel will adjust according to the mode of operation.
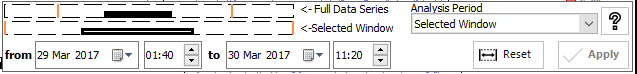
Full Data Series Bar: The total width of the bar indicates the full time period of data in the GAG layer. It provides a coarse means of adjusting the active time window for the GAG layer. Left clicking in the Full Data Series bar will set the start of the time window (or it can be entered directly into the "from" fields). Right clicking will set the end date for the time window (or it can be entered directly into the "to" fields). The solid black bar indicates the active time window that is being displayed/interrogated. Any orange lines indicate that the "selected window" bar has been used to refine the active time window.
Selected Window Bar: The total width of the bar indicates the currently selected window in the "full data series" bar. It provides a means of refining the active window selected in the "full data series" bar. Left clicking and right clicking (as per the full time series bar) will refine the start and end times of the selected window, respectively.
![]() Enter start and end dates directly.
Enter start and end dates directly.
![]() Reset end date to the current time.
Reset end date to the current time.
![]() Resets the time window to the length of the available data.
Resets the time window to the length of the available data.
![]() Select the period over which any time dependent active parameters are calculated (such as Last 24hrs rainfall, or total rainfall over the selected window).
Select the period over which any time dependent active parameters are calculated (such as Last 24hrs rainfall, or total rainfall over the selected window).
![]() Detailed pop-up help
Detailed pop-up help
![]() Apply changes to the time window. Changes are not applied until this button is clicked.
Apply changes to the time window. Changes are not applied until this button is clicked.
![]() Generate Summary Table of Gauge Data
Generate Summary Table of Gauge Data
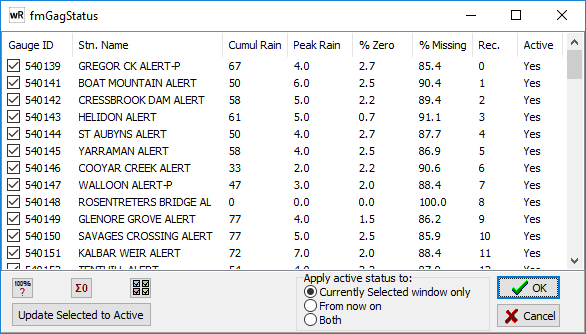
This tool provides a means of assessing the quality of gauge data. Should a gauge be considered "faulty", it can be turned off for either the current time window, or from "now on".
If a gauge is turned off, it will not be used in any flood forecasting rainfall inputs nor any analysis/display of gauge data over the period in which is set to inactive. Unreliable gauges can be turned off for specific time periods (eg faulty during an event), or indefinitely (eg the gauge has been decommissioned). Once gauges are made inactive, they are not included in any hyetograph creation (eg flood forecasting, hyetograph interpolation etc). This tool is only available for rainfall and river level gauges
Information in the table is displayed for the current time window.
To turn a gauge off/on:
1.Specify the gauges status by :
- clicking the tick box next to the gauge name
- ![]() Automatically identifying gauges where 100% of the readings are zero
Automatically identifying gauges where 100% of the readings are zero
- ![]() Automatically identifying gauges where cumulative rainfall is zero
Automatically identifying gauges where cumulative rainfall is zero
- ![]() Select all gauges
Select all gauges
2. ![]() Use current selections to temporarily set the status of the gauges. No changes are made to the gag layer at this stage.
Use current selections to temporarily set the status of the gauges. No changes are made to the gag layer at this stage.
3. Repeat above as required
4. 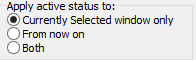 Specify the time window to update the status of the gauges over.
5. ![]() Sets the status of the gauges.
Sets the status of the gauges.
This tool generates a TINned surface between all rainfall gauges of the active parameter (generally "last period rain"). Once activated, hyetographs can be interpolated at any location on the surface.
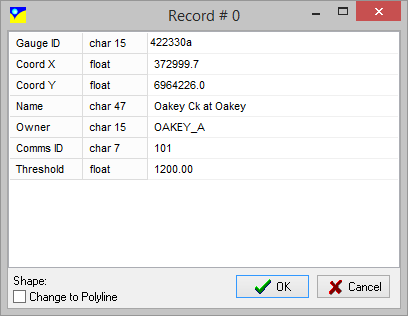
![]() Edit Gauge Layer Header information
Edit Gauge Layer Header information
This tool allows the header record for the selected gauge to be edited.